
Figures & data
Table 1. Literature search string in PubMed (July 2021).
Figure 1. PRISMA flow diagram.
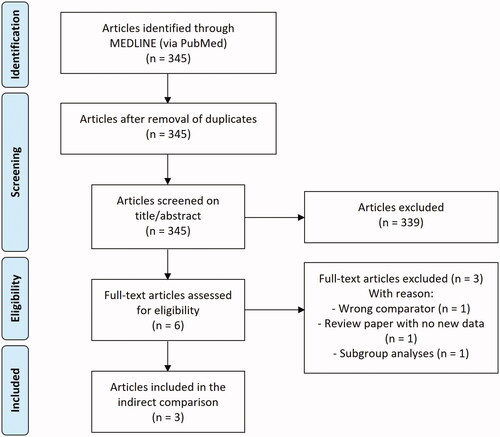
Table 2. PTCS questions matched with TPUQ questions covering five treatment satisfaction domains.
Table 3. Patient demographics and baseline characteristics.
Table 4. PGA treatment success and PASI75 response per week.
Table 5. Indirect comparison of PGA treatment success and PASI75 response between Cal/BDP cream and foam with the common comparator Cal/BDP gel.
Table 6. Change in DLQI from baseline—DLQI improvement.
Table 7. Indirect comparison of DLQI improvement between Cal/BDP cream and foam with the common comparator Cal/BDP gel.
Table 8. Indirect comparison of treatment satisfactiona in week 1 between Cal/BDP cream and foam with the common comparator Cal/BDP gel.
Data availability statement
The datasets generated and/or analyzed during the current study are not publicly available due to privacy reasons.