
Figures & data
Table 1. Baseline demographics (total VISIONARY study population).
Table 2. Change in mean intraocular pressure from baseline according to country (Country-level Subanalysis Population – countries recruiting ≥20 patients).
Figure 1. Percentage of responders according to different intraocular pressure reduction cut-off values at Month 6, according to country (Country-level Subanalysis Population -countries recruiting ≥20 patients). Abbreviations. IOP, intraocular pressure.
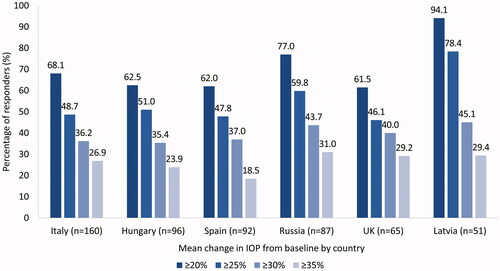
Table 3. Mean (SD) intraocular pressure change according to baseline monotherapy, by country (Country-level Subanalysis Population – countries recruiting ≥20 patients).
Figure 2. Mean percentage change in IOP at Month 6 according to baseline pressure and country, at each VISIONARY study visit (Country-level Subanalysis Population – countries recruiting ≥20 patients). Abbreviations. IOP, intraocular pressure.
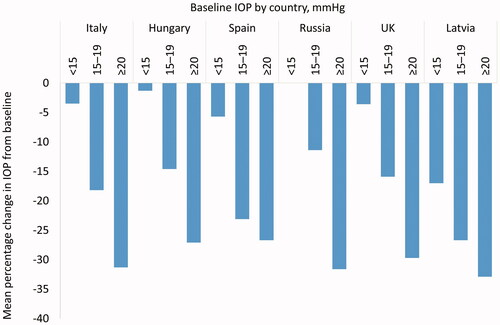
Table 4. Change in mean intraocular pressure from baseline according to timing of PF tafluprost/timolol FC dosing, by country (Country-level Subanalysis Population – countries recruiting ≥20 patients).
Table 5. Change in mean intraocular pressure at Month 6 from baseline according to diagnosis, by country (Country-level Subanalysis Population – countries recruiting ≥20 patients).
Table 6. Reported treatment-related adverse events according to country (Full Analysis Set).
Data availability statement
The datasets used during and/or analyzed during the current study are available from the corresponding author on reasonable request.