Figures & data
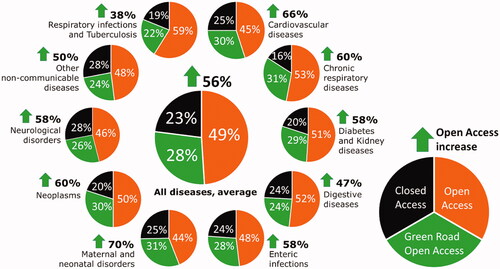
Figure 1. Percentage values of peer-reviewed papers (a total of 103,522 items published between January 1st and June 30th, 2020): open access (orange); closed access, but could have become open access (without embargo) using the green road (green); closed access, with the green road prohibited by publishers’ policies (black). The average value is unweighted. The value next to the green arrow indicates the increase in the open-access rate over the baseline.