
Figures & data
Figure 1. Analysis population. *Or equivalent scan (magnetic resonance elastography, shear wave elastography); †FAS (N = 54) included participants who enrolled, entered the lead-in period, were dosed with etranacogene dezaparvovec and provided ≥1 efficacy endpoint assessment; ‡PP population (N = 53) included all participants from the FAS who adhered to a stable and adequate prophylaxis use during the lead-in period, completed ≥18 months of efficacy assessments, and had no major protocol deviations that impacted the interpretation of efficacy. In the Phase 3 clinical trial, one participant 75 years of age, died at 464 days (∼15 months) following etranacogene dezaparvovec infusion from cardiogenic shock, preceded by a urinary tract infection, which was considered unrelated to treatment. Abbreviations. FAS, full analysis set; PP, per protocol.
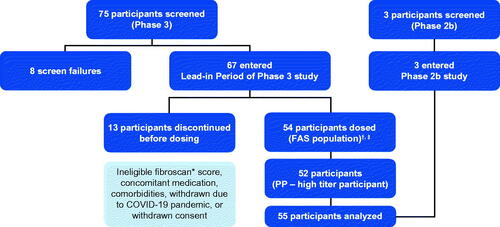
Figure 2. Distribution of observed factor IX activity levels over time. White point represents the mean value, the overlaid points on each boxplot show individual datapoints. Stable and durable factor IX activity levels are observed on average in the analysis population. Note: Most participants had not completed 24- and 30- month follow-up by database lock (participants are not lost to follow-up, just not observed yet).
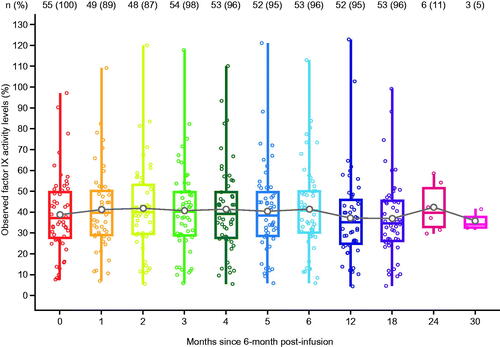
Table 1. Baseline characteristics of the analysis population.
Table 2. Number of participants and mean (SD) factor IX activity level at 6 months post-infusion by pre-infusion AAV5 NAb status and post-treatment ALT elevation.
Figure 3. Distribution of observed factor IX activity levels by AAV5 NAb status over time. Red point represents the mean value, the overlaid points on each boxplot show individual datapoints. Stable and durable factor IX activity levels are observed on average in both NAb subgroups in the analysis population. Note: Most participants had not completed 24- and 30- month follow-up by database lock (participants are not lost to follow-up, just not observed yet). Abbreviations. AAV5, adeno-associated virus 5; NAb, neutralizing antibody.
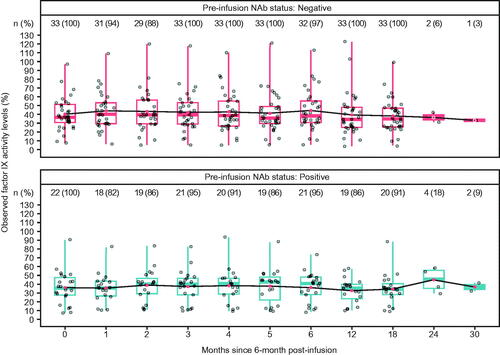
Figure 4. Estimated (median) factor IX activity levels extrapolated to 25 years post-analysis baseline with 95% prediction intervals: Bayesian approach with pre-infusion AAV5 NAb status as covariate (N = 55). Abbreviations. AAV5, adeno-associated virus 5; NAb, neutralizing antibody.
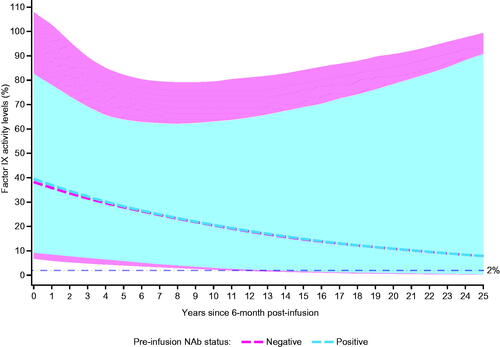
Figure 5. Predicted cumulative proportion of participants with factor IX activity levels <2% for 1000 future participants: Bayesian model-based predictions with pre-infusion AAV5 NAb status as a covariate. Percentages are based on N’s in each subgroup. Abbreviations. AAV5, adeno-associated virus 5; NAb, neutralizing antibody.
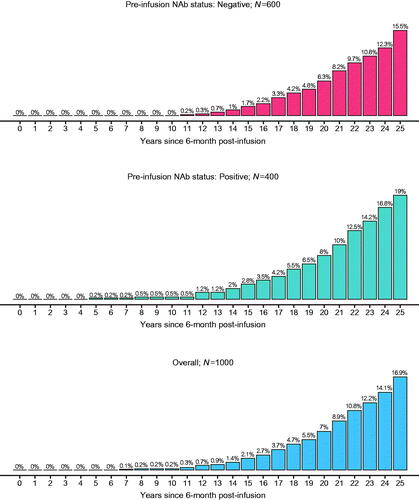
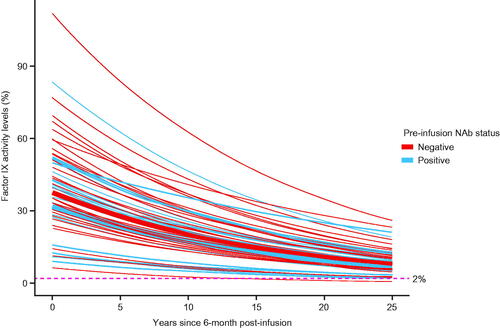
Figure 6. Predicted (mean) factor IX activity levels of 55 participants over 25 years post-analysis baseline by pre-dose AAV5 NAb status: Frequentist approach (N = 55). Abbreviations. AAV5, adeno-associated virus 5; NAb, neutralizing antibody.
Reviewer_response_Suppl_Mat_Durability_assessment_of_Etranacogene_Dezaparvovec_FINAL_04102022.docx
Download MS Word (1.6 MB)Data availability statement
The data that support the findings of this study are available on request from the corresponding author, Jinesh Shah. The data are not publicly available as they contain information that could compromise the privacy of study participants.