Figures & data
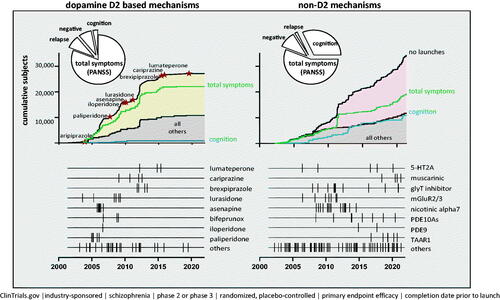
Figure 1. Summary of 203 industry-sponsored Phase II/III clinical trials conducted since January 2002 designed to test the efficacy of novel dopamine D2 and non-D2 treatments for schizophrenia. The pie charts summarize the proportion of subjects randomized in Phase 2/3 clinical trials. In the line graph (for both D2 and non-D2 mechanisms), the top black line represents the cumulative number of subjects enrolled into Phase 2/3 efficacy studies over time. The green line (total symptoms) represents the cumulative number of subjects enrolled in efficacy studies where the primary measure was “total symptoms” (i.e. PANSS total score); the blue line represents the cumulative number of subjects where a cognitive assessment was the primary measure; and the lower black line represents the cumulative number of subjects enrolled in studies investigating compounds that are not listed in the linear time-plots at the bottom of each panel. In the linear time-plots of D2 drugs, the hatched lines represent start dates of Phase 2/3 studies that were completed prior to FDA approval of the listed compound. In the linear time-plots of non-D2 drugs, the hatched lines represent the start dates of the Phase 2/3 clinical studies.