
Figures & data
Figure 1. Survey respondents’ medical specialties. Figure adapted from Gupta et al.Citation11.
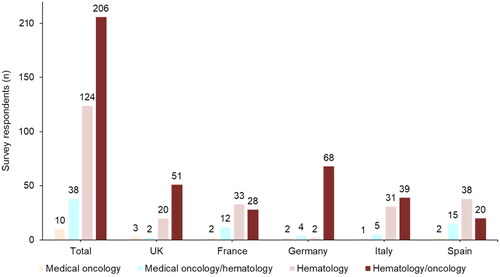
Table 1. Physician characteristics by country.
Figure 2. Consequences of blood supply shortages, (A) length of treatment delay; (B) percent of patients requiring additional visits to healthcare providers. Numbers to the right of the data bars indicate the mean, and error bars show the upper limit of the 95% CI. Abbreviations. CI, confidence interval; n, number of physicians with observations.
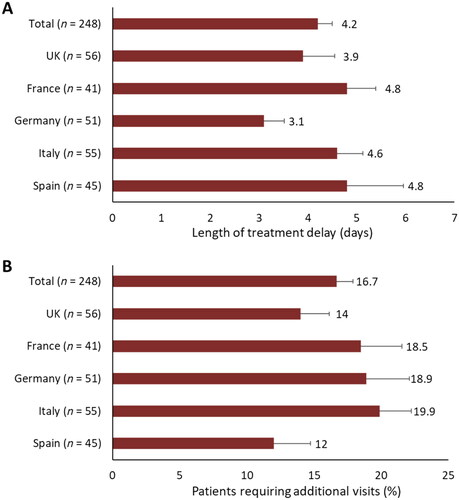
Table 2. Blood supply shortage metrics for patients with MDS requiring RBC transfusions.
Table 3. Top 10 factors and mean impact scores by country.
Gupta__CMRO__Physican_survey_MS_Supp_Material_Nov_17_clean.docx
Download MS Word (54.9 KB)Supp_Table.docx
Download MS Word (47.4 KB)Data availability statement
Bristol Myers Squibb policy on data sharing may be found at https://www.bms.com/researchers-and-partners/independent-research/data-sharing-request-process.html.