
Figures & data
Table 1. Regulatory policy, frameworks and definitions of RWD/RWE.
Figure 1. Data saturation. Bars represent the percentage of unique items generated by participants in order of entry into the study; line represents the cumulative percentage of unique items, which was achieved by three participants in total.
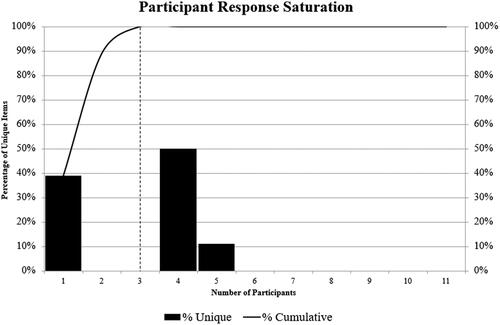
Table 2. Definition items generated by participants.
Table 3. Conceptual maturity of the generated definition of real-world evidence.
Data availability statement
The authors confirm that the data supporting the findings of this study are available within the article.