
Figures & data
Figure 1. PRISMA flowchart of the selection process.
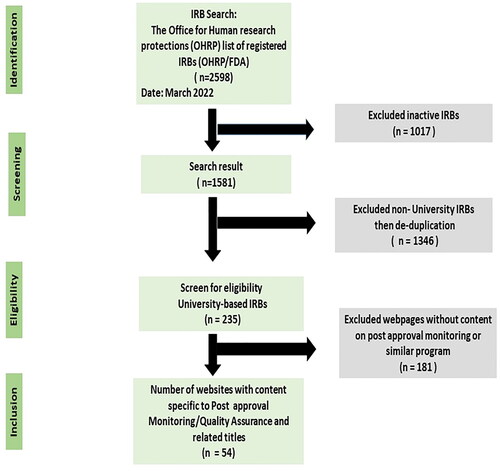
Table 1. States (30) and names of selected institutions (54).
Figure 2. Final thematic map showing main themes and explanations.
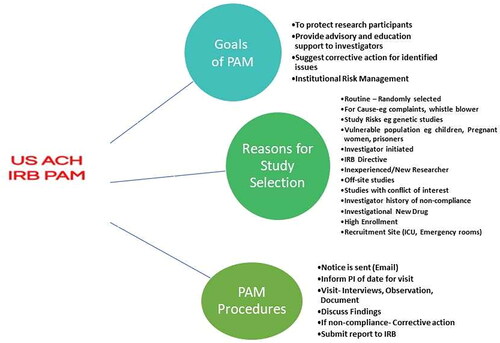
Table 2. Thematic examples of reasons for PAM.
Figure 3. Descriptors identified as reasons for study selection. The diagram is intended to provide insight into some of the listed reasons for study selection. It should not be interpreted to mean that some AHCs do not include these reasons in their programs. The data analyzed is from webpages and as such is limited. AHCs may have internal practice, policies and procedures that are not reflected on the webpages. This is a limitation of this type of study.
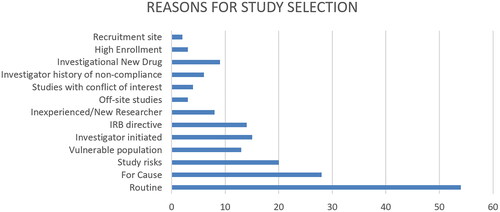
Table 3. Documents reviewed by PAM monitors and commonly identified non-compliance issues.
Table 4. Legislative and policy support for HRPP in the USA.