
Figures & data
Table 1. Patient characteristics at baseline.
Figure 1. Time to first clinical remission among patients with UC treated with advanced therapy. Abbreviation. UC, ulcerative colitis.
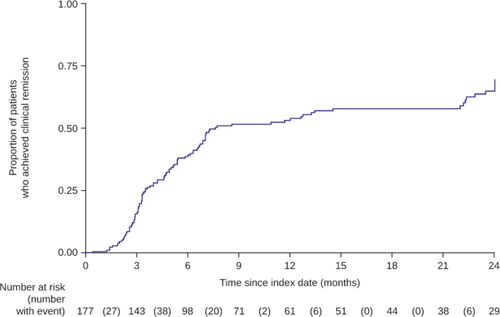
Figure 2. Inadequate response to index therapy by indicator measured at 3, 6, 12, and 24 months. Abbreviations. CS, corticosteroid; ED, emergency department; UC, ulcerative colitis.
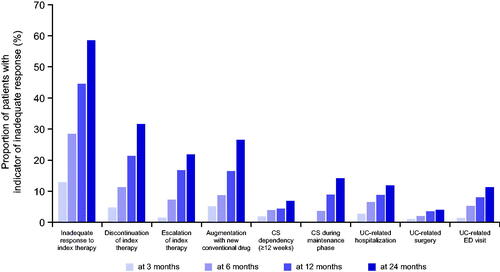
Figure 3. Time to any indicator of inadequate response among patients with and without remission within the first 12 months, treated with advanced therapy.
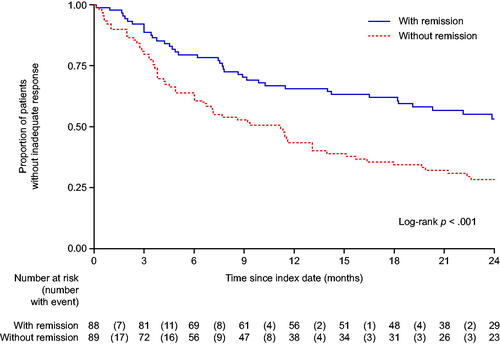
Table 2. Multivariate Cox regression model for the first achievement of clinical remission during index therapy.
Table 3. Multivariate Cox regression model for first inadequate response to advanced therapies.
Table 4. Primary reason for discontinuation of index therapy.
Suppl_Figure_02.pdf
Download PDF (1.3 MB)Suppl_Figure_01.pdf
Download PDF (1.2 MB)UK_chart_review_manuscript_CMRO_12Oct22_supplemental.docx
Download MS Word (207.8 KB)Data availability statement
The data that support the findings of this study are available from the corresponding author upon reasonable request.