
Figures & data
Figure 1. PRISMA flow diagram of the screening process and study selection for the assessment of the economic impact of CMV.
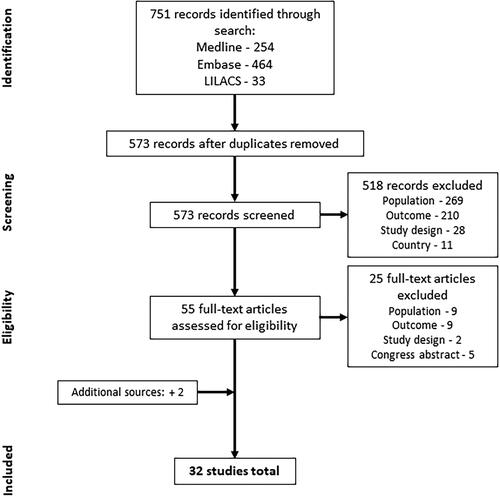
Table 1. Summary of included studies (n = 24) reporting direct healthcare costs/charges, resource utilization and indirect costs related to CMV or cCMV.
Table 2. Summary of included economic evaluations of interventions related to CMV or cCMV (n = 7).
Table 3. Summary of other studies reporting the burden of cCMV (n = 1).
Supplemental material
Supplemental Material
Download PDF (302.9 KB)Buck_Supplemental_Material.docx
Download MS Word (153.7 KB)Data availability statement
The data summarized from this review are from published articles and are publicly available.