
Figures & data
Table 1. Characteristics of the patients admitted with index DKA episode.
Figure 1. (A) Frequency of Overall DKA admissions in Islamic months. (B) Frequency of DKA admissions in Islamic months based on new versus pre-existent DM. (C) Frequency of DKA admissions in Islamic months based on the type of DM. (D) Frequency of DKA admissions in Islamic months based on the severity of DKA. X-axis represent number of DKA admissions and Y-axis represent Islamic calendar months.
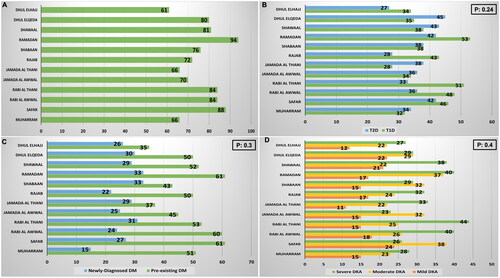
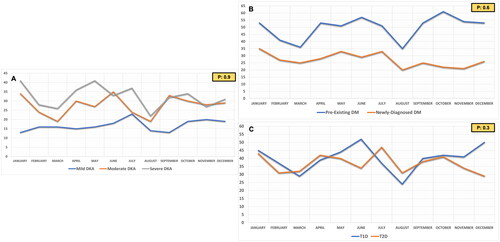
Figure 2. (A) Frequency of DKA admissions in Roman months based on the severity of DKA. (B) Frequency of DKA admissions in Roman months based on new versus pre-existent DM. (C) Frequency of DKA admissions in Roman months based on the type of DM. X-axis represent the Roman calendar months and Y-axis represent number of DKA admissions.
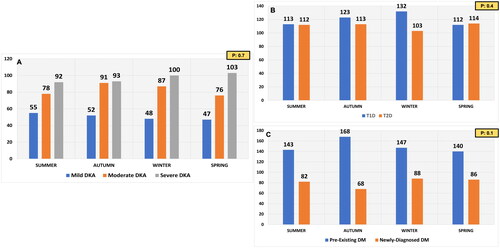
Figure 3. (A) Frequency of DKA admissions in different seasons based on the severity of DKA. (B) Frequency of DKA admissions in different seasons based on the type of DM. (C) Frequency of DKA admissions in different seasons based on new versus pre-existent DM. X-axis represent the four seasons and Y-axis represent number of DKA admissions.
Data availability statement
Available from the corresponding author upon reasonable request.