
Figures & data
Table 1. Demographic and clinical characteristics of patients in the total cohort and in subgroups of interest.
Figure 1. Parkinson’s disease symptoms at baseline.
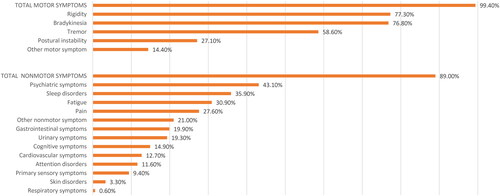
Table 2. Concomitant PD treatments at the start of safinamide.
Table 3. AEs and SAEs overview in the FAS and relevant subgroups.
Table 4. Fluctuations at the start of treatment with safinamide and during the follow-up.
Table 5. Distribution of adverse events (AE) severity by system organ class.
Figure 2. Summary for AE and SAE.
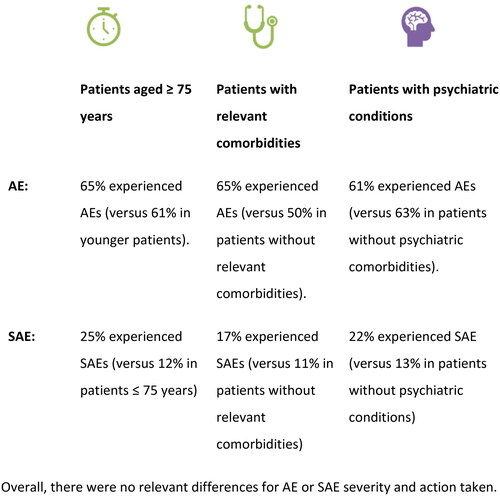
Table 6. UPDRS scores.
Data availability statement
The raw data supporting the conclusions of this article will be made available by the authors, without undue reservation upon request.