
Figures & data
Figure 1. Data saturation. The percentage of unique items from participants is represented by the bars, and in the order that they joined the study, with the x-axis representing both the participant number and the number of participants required for data saturation as represented by the cumulative percentage of unique items. The y-axis presents a continuous scale for percentages from which the % uniqueness and the cumulative percentage can be derived.
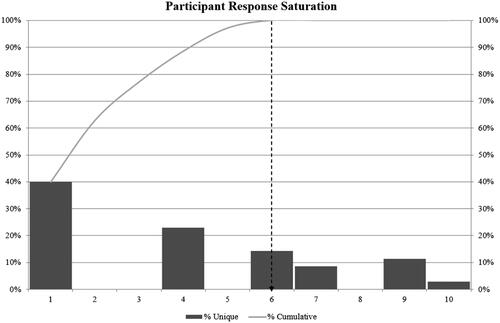
Table 1. Awareness and consensus scores for research questions.
Table 2. Categorical research questions attaining consensus in survey 2 (CR2).
Data availability statement
The data that support the findings of this study are available from the corresponding author, R Jandhyala, upon reasonable request.