Figures & data
Table 1. Functional impairment and select satisfaction follow-up survey items.
Figure 1. Participant baseline, Week 4 and Week 12 survey completion profile.
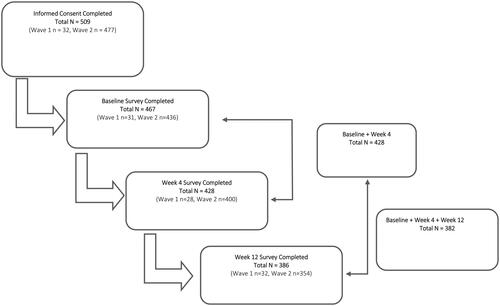
Figure 2. Percentage of Survey participants reporting pain on NRS pain Scale.
Scores are based on the pain NRS, with 0 = no pain and 10 = worst possible pain.
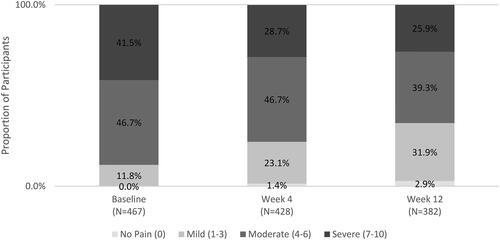
Figure 3. Percentage of Survey participants that changed to a better pain category from baseline.
Scores are based on the pain NRS, with 0 = no pain and 10 = worst possible pain.
Abbreviation. NRS, Numeric Rating Scale.
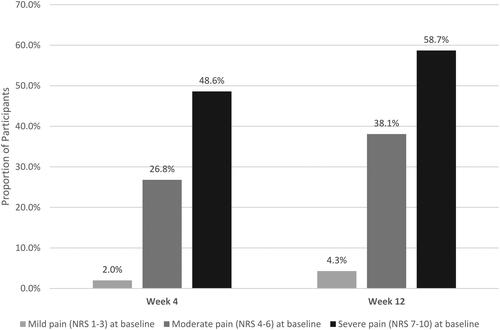
Figure 4. Percentage of Survey participants with improvement in ability to participate in functional activities from baseline to weeks 4 and 12.
Improvement defined as selecting ‘A little better’, ‘Much better’, or ‘Very much better’ when asked to describe ability to participate in functional activities compared to baseline.
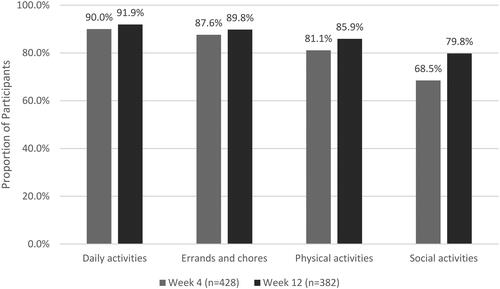
Figure 5. Percentage of Survey participants reporting at least moderate pain interference with functional activities at baseline, Week 4 and Week 12.
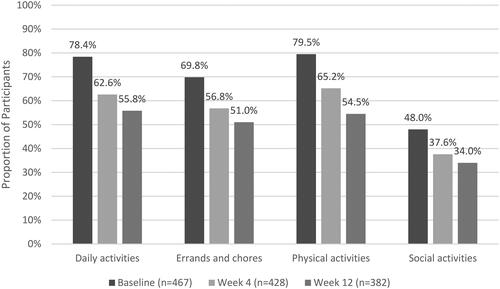
Figure 6. Participant satisfaction with treatment results at Week 4 and 12 (survey).
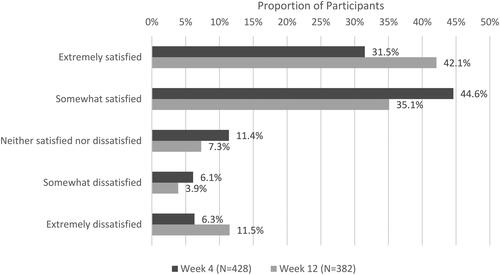
Table 2. Reasons for satisfaction with VGD treatment results among survey participants.
Table 3. Satisfaction with VGD treatment results for survey participants with "quite a bit” or “extreme” interference with functional activities at baseline.
Table 4. VGD Use, pain, and treatment satisfaction results between older and younger survey population.
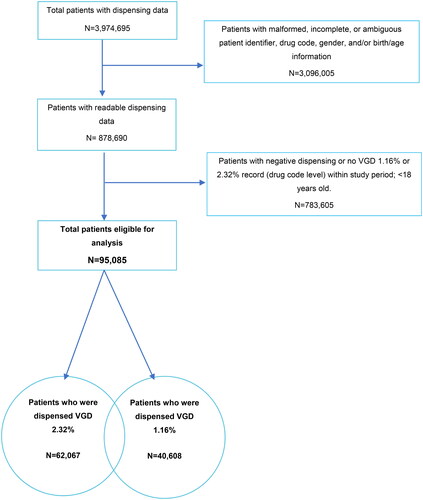
Figure 7. Patient selection data flow from pharmacy dispensing software.
Negative dispensing could occur if a patient returned previously collected drug. Patients with dispensing <0 returned all dispensed packs within the study period.
The sum of patients who were dispensed 2.32% and 1.16% strength is greater than the total patients eligible for analysis because some patients had both strengths dispensed during the 12-month period.
Abbreviations. VGD, Voltaren gel diclofenac.