
Figures & data
Figure 1. Recruitment process
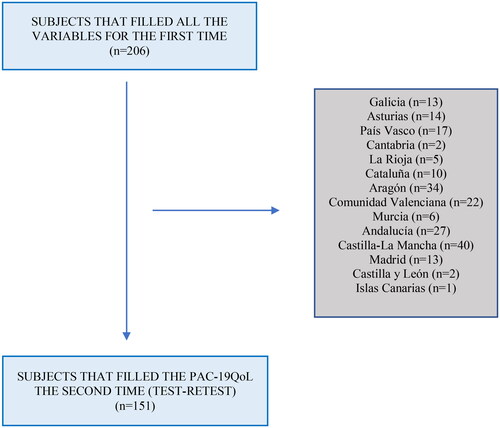
Table 1. Socio-demographic characteristics of the sample population.
Table 2. Clinical data and covid-19 and long covid characteristics of the sample population.
Figure 2. Sedimentation graph of factor components of PAC-19QOL.
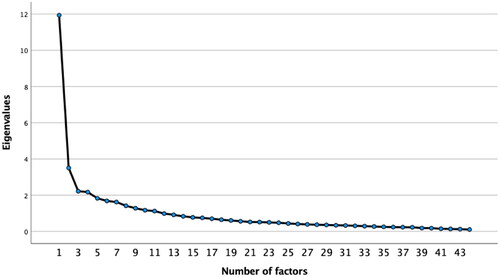
Table 3. Exploratory factor analyses: factor loadings after varimax rotations of PAC-19qol questionnaire.
Table 4. Mean score of the sf-12 index by quality-of-life category, by ancova models controlling for age, by sex.