
Figures & data
Figure 1. Patient disposition for Studies 1 and 2.
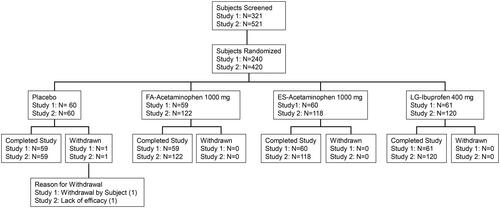
Figure 2. Kaplan-Meier plots of time to confirmed perceptible pain relief in Study 1 (a) and Study 2 (b).
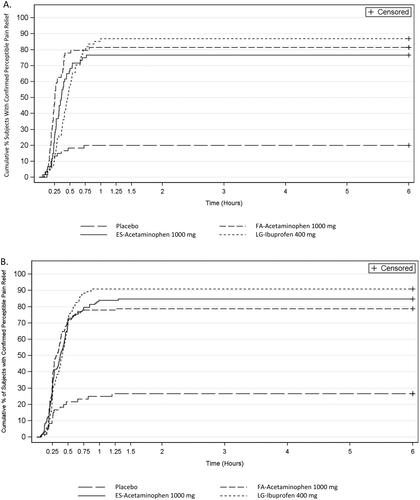
Table 1. Summary of pain relief, pain intensity differences, use of rescue medication, and subject global evaluation during the 6 h treatment period.
Figure 3. Kaplan-Meier plots of time to meaningful pain relief in Study 1 (A) and Study 2 (B).
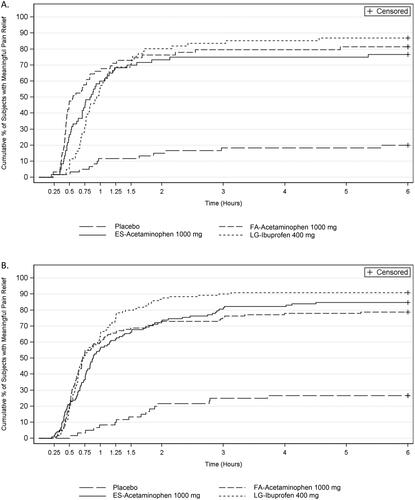
Figure 4. Time course of pain intensity difference (PID) scores for each treatment in Study 1 (A) and Study 2 (B). Data presented as least squares mean (LSMean) ± standard error (SE).
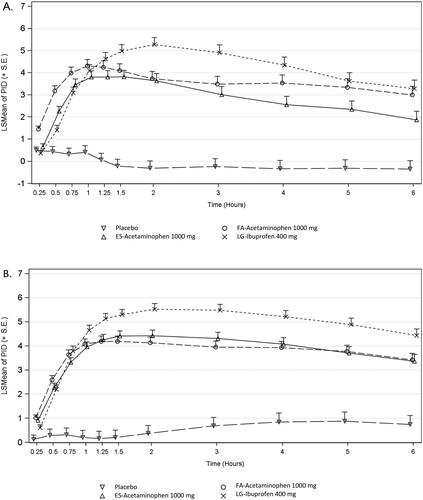
Table 2. Plasma concentrations (μg/mL) following a single oral dose of study drug.
Supplemental material