
Figures & data
Table 1. Study inclusion and exclusion criteria.
Table 2. Participants’ sociodemographic and clinical characteristics.
Table 3. Summary of key and frequently endorsed NASH symptoms with example quotes from study participants.
Figure 1. Average severity ratings for key and frequently endorsed NASH symptoms. n number of participants, NASH non-alcoholic steatohepatitis. Note: Key symptoms refer to those identified from the targeted literature review; frequently endorsed symptoms refer to those reported by five or more participants. Participants were asked to rank symptom severity on a scale of 1 to 10 (1 = not severe; 10 = extremely severe).
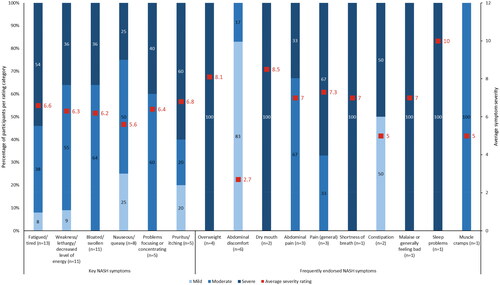
Figure 2. Average bother ratings for key and frequently endorsed NASH symptoms. n number of participants, NASH non-alcoholic steatohepatitis. Note: Key symptoms refer to those identified from the targeted literature review; frequently endorsed symptoms refer to those reported by five or more participants. Bother rating categories were low (1-3), moderate (4-6), or high (7-10).
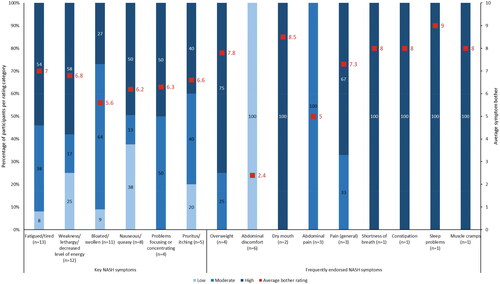
Table 4. Topmost bothersome NASH symptoms and impacts.
Table 5. Summary of the impact of NASH with example quotes from study participants.
Table 6. Participant descriptions of a good and bad day with NASH.
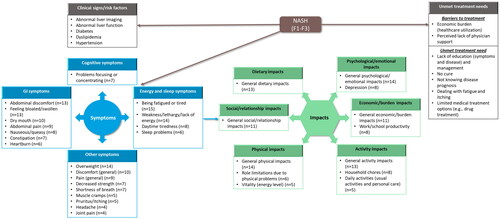
Figure 3. Conceptual model of NASH: participants’ perceptions of NASH clinical signs, symptoms, impact, and unmet treatment needs. F fibrosis stage, GI gastrointestinal, n number of participants, NASH non-alcoholic steatohepatitis. Note: Concepts listed within grey boxes were identified from the targeted literature review; concepts listed within blue (symptoms) and green (impacts) boxes were identified from both the targeted literature review and qualitative interviews.
Supplemental Material
Download MS Word (46.9 KB)Data availability statement
The data that support the findings of this study are available from the corresponding author, SS, upon reasonable request.