
Figures & data
Table 1. Demographic information (all subjects).
Table 2. Prevalence of PN based on MNSI results (all subjects).
Figure 1. Venn diagram of NTSS-6 most reported symptoms (numbness and prickling). Three of the 448 PN subjects had missing responses for NTSS-6. NTSS-6, Neuropathy Total Symptom Score-6; PN, peripheral neuropathy. Numbers in and next to circles are absolute numbers (n).
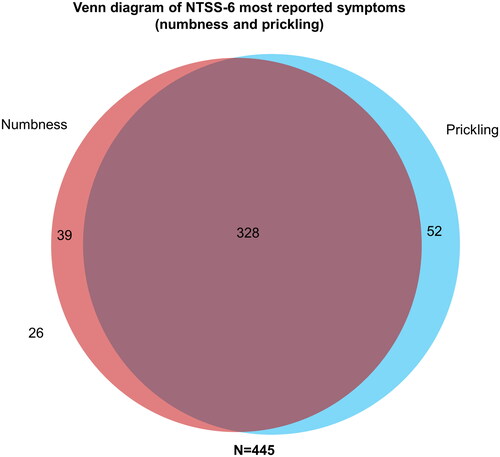
Figure 2. Intensity and frequency of NTSS-6 items in subjects with PN. Three subjects had missing responses for NTSS-6. NTSS-6, Neuropathy Total Symptom Score-6; PN, peripheral neuropathy.
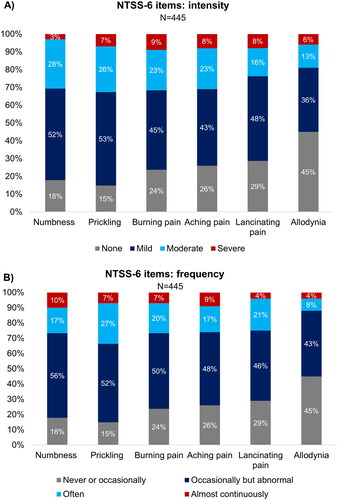
Figure 3. HCP who diagnosed PN. HCP, healthcare professional; PN, peripheral neuropathy. Data extracted from Quality of Life Pharmacoeconomic Questionnaire.
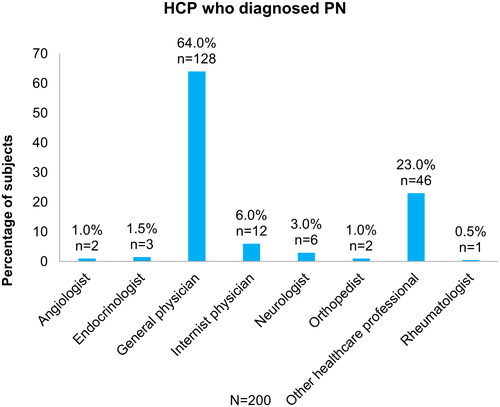
Table 3. Information regarding PN diagnosis (subjects with PN only).
Table 4. Prescribed treatment and supplements taken in addition (subjects with PN only).