Figures & data
Table 1. Approved posology and administration for anti-VEGF treatments licensed for use in nAMD in the UK.
Table 2. Population, concept and context inclusion and exclusion criteria.
Figure 1. Modified preferred reporting items for systematic reviews and meta-analysis (PRISMA) flow chart adapted from Page MJ, McKenzie JE, Bossuyt PM, Boutron I, Hoffmann TC, Mulrow CD, et al. The PRISMA 2020 statement: an updated guideline for reporting systematic reviews. BMJ 2021;372:n71. doi:10.1136/bmj.n71. For more information, visit: http://www.prisma-statement.org/.
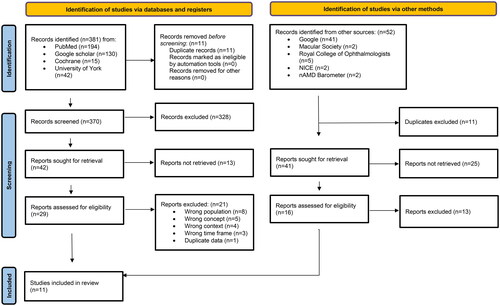
Figure 2. Clinic cost misclassification plot showing false negative and false positive rates for HTAmin and HTAmax at 20%, 50% and 80% prevalence. Minimum: HTAmin; Maximum: HTAmax. False positive rate = 0, following specificity results.
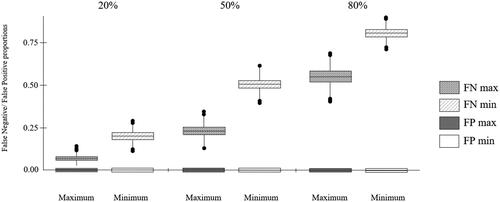
Table 3. Neutrality analysis for HTAmin and HTAmax.
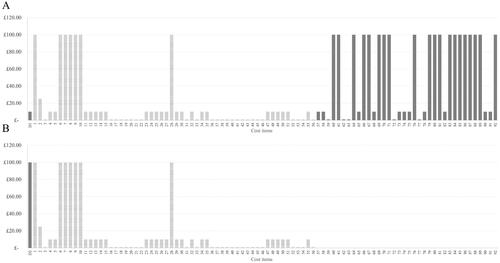
Figure 3. Comparative cost-effectiveness decision-making from HTA perspective showing estimated drug acquisition cost magnitudes for hypothetical drug 1 (A) and drug 2 (B): D1, D2: anti-VEGF drug acquisition cost; Items 1–3: non-anti-VEGF drug acquisition costs. Shaded bars show differentiating cost items.
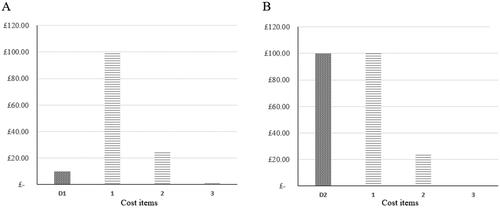
Figure 4. Comparative cost-effectiveness decision-making using the nAS, illustrating the impact of strain costs on two hypothetical nAMD anti-VEGF treatments. This figure shows that the lower cost drug (D1) incurs higher costs of strain, despite its lower acquisition cost. This is attributed to the higher frequency of treatments and monitoring required to maintain its efficacy, which increases operational costs during periods of clinic strain. The higher cost drug (D2), while more expensive upfront, demands fewer clinic visits, thereby incurring lower strain-related costs. This visualization underscores the importance of considering visit frequency and operational strain in total treatment cost assessments. The list of cost items is provided in Appendix 7: Supplemental Table 7.