Figures & data
FIG. 1 Top view (A) and side view (B) of a deformable silicon-well chamber containing a 16-mm-long × 10-mm-wide silicon membrane at its base. Ten wells are able to be simultaneously mounted on a multistation cell-stretching device. Arrows indicate the direction of applied stretching. (C) Sampling regime for the PCR studies. * Time 0 is defined as the point at which the stretching was terminated.
TABLE 1 Primers specific for β actin (ACTB), β1 integrin (ITGB), type-I collagen alpha1 (COL1A1), type-I collagen alpha2 (COL1A2), type-III collagen alpha1 (COL3A1), and GAPDH control
FIG. 2 Confocal laser scanning microscopy. The cytoskeletal organization of a ligament fibroblast in the control group (A, B, C) and the stretched group (D, E, F) (Bar: 20 μm). The double-headed arrows represent the direction of applied stretching. In the control group, the actin stress fibers (A: green) and vimentin meshwork (B: red) are distributed randomly. (C) Merged image (nucleus: cyan). After stretching, the actin stress fibers (D: green) and vimentin meshwork (E: red) are oriented parallel to the longitudinal axes of the cells. (F) Merged image.
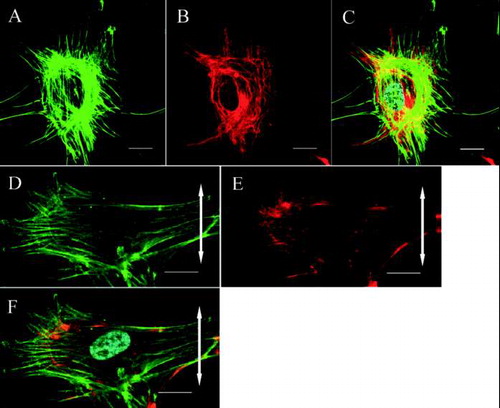
FIG. 3 Confocal laser scanning microscopy. Effects of cyclic stretching on the distribution of β1 integrins within ligament fibroblasts (Bar: 20 μm). (A) In the control group, the β1 integrins (green) are randomly distributed within the plasma membrane attached to the silicon substrate and have a dot-like appearance. (B) In the stretched group, the β1 integrins are strongly distributed on the polar sides of the stretched cells and have a linear shape. The double-headed arrow indicates the direction of applied stretching.
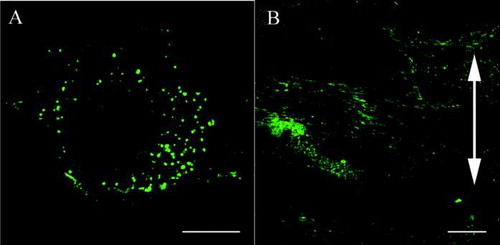
FIG. 4 Both β1 integrin (A) and actin stress fibers (B) within a fibroblast are aligned perpendicular to the direction of applied stretching (double-headed arrows). The merged image (C) and its schematic drawing (D) show that β1 integrin is distributed at both ends of the actin stress fibers (Bar: 20 μm).
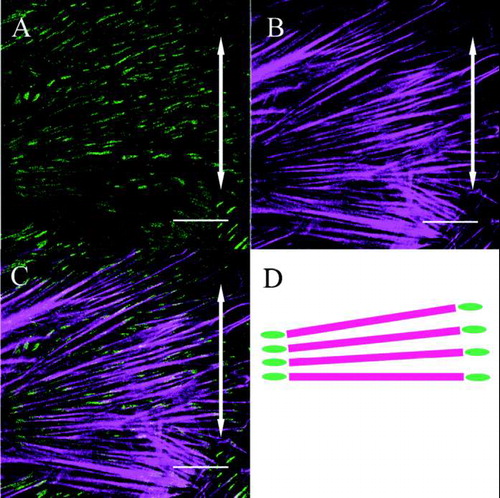
FIG. 5 Time-dependent effects of cyclic tensile stretching on the gene expressions of β actin (ACTB), β1 integrin (ITGB), type-I collagen alpha1 (COL1A1), type I collagen alpha2 (COL1A2), and type III collagen alpha1 (COL3A1) in ligament fibroblasts. The relative expression level represents the target gene expression relative to GAPDH in the stretched group normalized to the control group. *p < 0.05.