Figures & data
Table 1. ROM of the ankle joint during dorsiflexion and CSA of the myofibers of the soleus muscle.
Figure 1. Histological observation of the soleus muscle stained with hematoxylin and eosin. No muscle fiber necrosis or regenerating fibers were observed in the muscles. In the immobilization and muscle control groups, atrophic changes in the muscle fibers were observed and compared with that of the control group. A: Control group. B: Immobilization group. C: Muscle contraction group. Magnification 100×, scale bar = 100 µm.
Figure 2. Fluorescence immunostaining for type I (A–C) and type III (D–F) collagen in the rat soleus muscle. In the perimysium (arrow), the expressions of type I and type III collagen in the immobilization (B,E) and muscle contraction groups (C,F) were markedly stronger and thickened, more notably in the immobilization group, compared with the control group. In the endomysium (arrowhead), a higher expression of type I collagen was obvious in the immobilization group (B) compared to the control group (A). However, in the muscle contraction group (C), the expression of type I collagen in the endomysium was similar to the findings in the control group (A). Magnification 100×, scale bar = 100 µm.
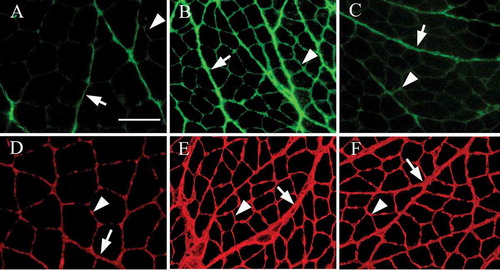
Figure 3. Quantification of type I and type III collagen. The fluorescence intensity of the perimysium and endomysium of type I collagen (A, perimysium; B, endomysium) and type III collagen (D, perimysium; E, endomysium). The fluorescence-intensity levels of types I and III collagen in the perimysium (A,D) and endomysium (B,E) in the immobilization (IM) and muscle contraction (MC) groups were significantly increased compared to those of the control group, whereas the intensity level in the MC group was significantly decreased compared to that of the IM group. The mRNA expression levels of type I collagen (C) and type III collagen (F) in real-time RT-PCR. The expressions of type I and type III collagen mRNA in the IM group were significantly increased compared to the control group values. In the MC group, the mRNA expression level of both types of collagen was significantly decreased compared to those of the IM group. Data are mean ± SD; *p < 0.05.
Figure 4. The expression levels of HIF-1α, TGF-β1, and α-SMA mRNA. The mRNA expression levels of HIF-1α (A) and TGF-β1 (B) in the immobilization (IM) group were significantly increased compared to those in the control and muscle contraction (MC) groups. There were no significant differences between the control and MC groups. The mRNA expression levels of α-SMA (C) in the IM and MC groups were significantly increased compared to the control group values. However, the expression level of mRNA in the MC group was decreased significantly compared to that of the IM group. Data are mean ± SD; *p < 0.05.