
Figures & data
Figure 1. Design of the recruitment of patients.
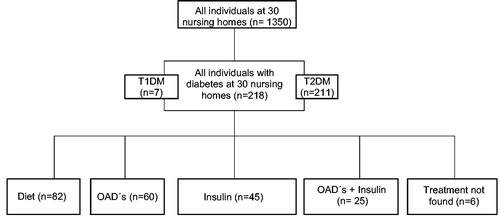
Figure 2. The correlation between HbA1c (mmol/mol) and diabetes duration (years); P = 0.006.
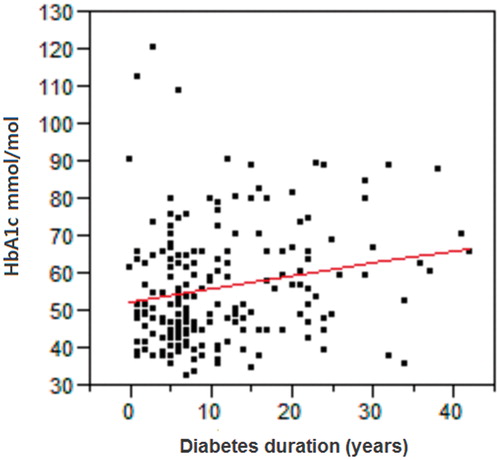
Table 1. Clinical characteristics of 218 diabetes patients at 30 nursing homes, and type of diabetes treatment. Patients were divided into three groups by their different HbA1c levels.
Table 2. Patients treated with insulin as single therapy or in combination with oral antidiabetic drugs. Daily doses expressed in international units. The patients were divided into three groups by different HbA1c levels.
Table 3. Patients with diabetes vascular complications and hypoglycaemic episodes. The patients were divided into three groups by different HbA1c levels.
Table 4. Hypoglycaemic episodes in subsets of patients given glucose-lowering pharmacological treatment. The patients were divided into three groups by different HbA1c levels.