Figures & data
Figure 1. Mean age of first-time mothers and fathers in Sweden and Norway 1970–2014.
Source: Statistics Sweden and Statistics Norway.
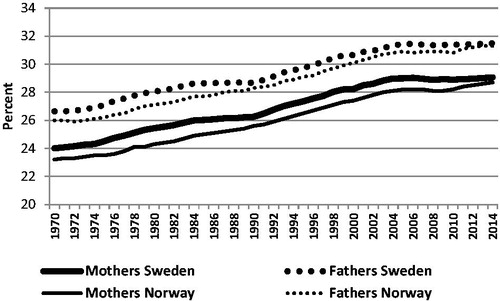
Table 1. Associations between childlessness at age 32 and family background, assessment of own parents, and attitudes to children reported at age 22 years (n = 1000).
Figure 2. Reasons for remaining childless in women and men at age 28 and 36 + 40 years. More than one reason possible.
Source: Data obtained from Schytt et al., 2014 (Citation7).
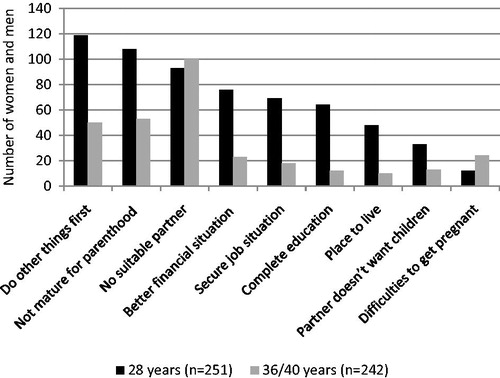
Figure 3. Rates of nulliparous women who have had a miscarriage or been treated for infertility, related to maternal age (n = 41,236 women pregnant with their first child).
Source: Figure based on a previously published figure by Nilsen et al., 2012 (Citation8).
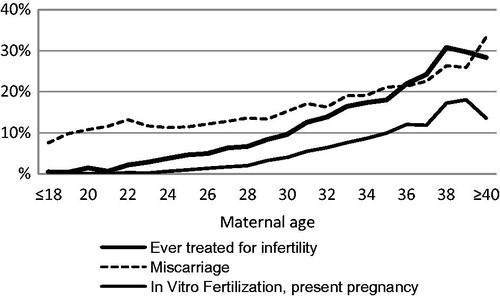
Figure 4. Risk of very preterm birth (22–31 gestational weeks) (PTB) in relation to advanced maternal age in primiparous women in Sweden and Norway. Adjusted odds ratios and 95% confidence intervals (CI). Sweden: n = 644,184; Norway: n = 311,620. Logistic regression analyses adjusted for year of birth, civil status, country of birth, smoking, BMI, chronic hypertension, and diabetes. Source: Figure based on data obtained from Table 1 in Waldenström et al., 2014 (Citation26).
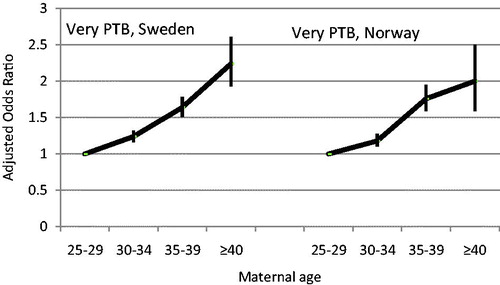
Figure 5. Risk of stillbirth in relation to advanced maternal age, smoking in early pregnancy, and being overweight or obese. Adjusted odds ratios and 95% confidence intervals (n = 644,184 primiparous women). Logistic regression model including maternal age, smoking, body mass index, and the following potentially confounding factors not shown: year of birth, civil status, country of birth, chronic hypertension, and diabetes. Source: Figure based on data obtained from Table 2 in Waldenström et al., 2014 (Citation26).
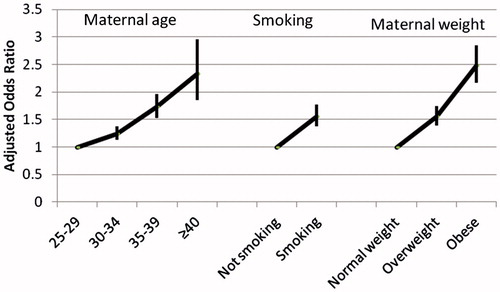
Table 2. Stillbirth in relation to maternal age in first, second, third, and fourth or more births stratified by level of education.
Figure 6. Postnatal assessment of childbirth by maternal age (n = 1184 primiparous women).
Source: Figure previously published by Zasloff et al. 2007 (Citation40).
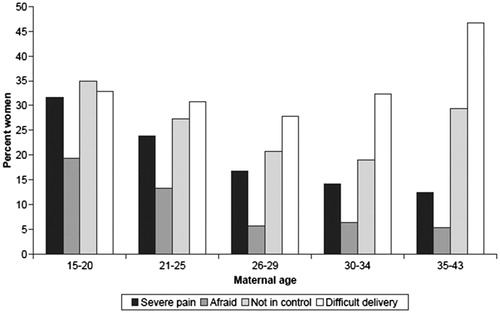
Figure 7. Depressive symptoms and worries during pregnancy by maternal age (n = 1304 primiparous women).
Source: Figure previously published by Zasloff et al. 2007, page 1331 (Citation40).
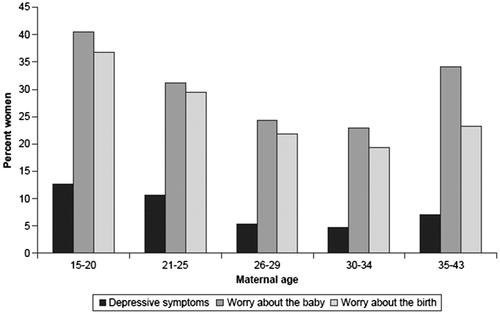
Figure 8. Psychological distress (SCL-5 ≥ 1.75) in primiparous women by maternal age, in weeks 17 and 30 of gestation and 6 and 18 months after birth (n = 19,291 primiparous women).
Source: Figure previously published by Aasheim et al., 2012 (Citation46).
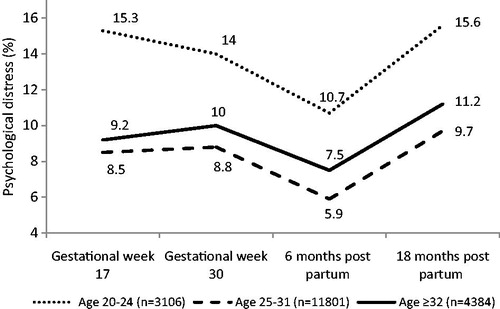
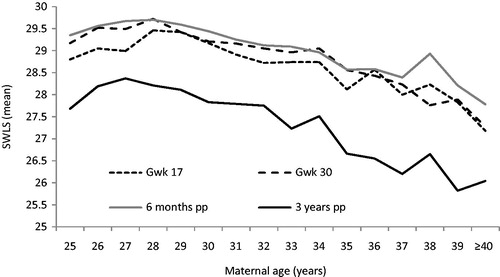
Figure 9. Satisfaction with life (SWLS, mean score) in gestational weeks 17 and 30 and at 6 months and 3 years after birth in relation to maternal age (n = 5891 primiparous women).
Source: Figure previously published by Aasheim et al., 2014 (Citation48).