Figures & data
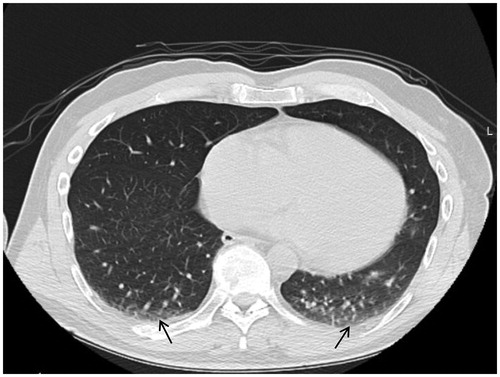
Figure 1. Consort diagram of study.
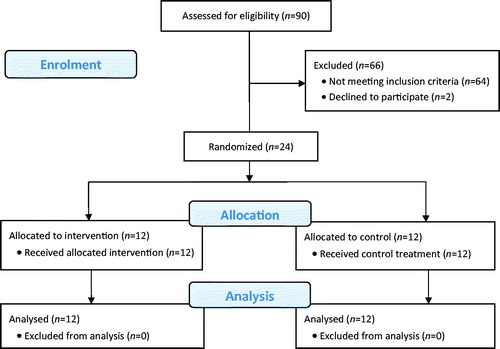
Table 1. Patient characteristics and baseline physiological data in the two study groups.
Figure 2. End-tidal oxygen concentration (EtO2) and time during anaesthesia after completed preoxygenation, induction, and intubation. Oxygen washout group, t0 = start of oxygen washout manoeuvre. Control group, t0 = start of maintenance ventilation using a fresh gas flow of 1 L/min with a fractional oxygen content of 0.40.
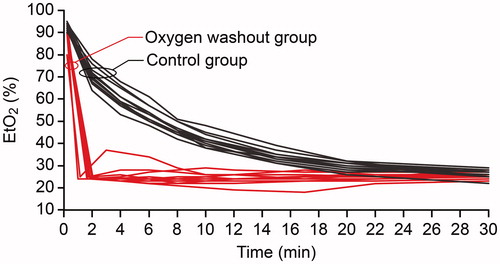
Figure 3. Atelectasis area sizes, as expressed by percentages of total lung area in the two groups. Data presented as median, interquartile range (box) and range (whiskers), P = .98. Dots represent outliers, one in each group (subjects no. 9 and no. 19). CT scans to study atelectasis area sizes were performed 5–10 mm above the right diaphragm dome at the end of surgery.
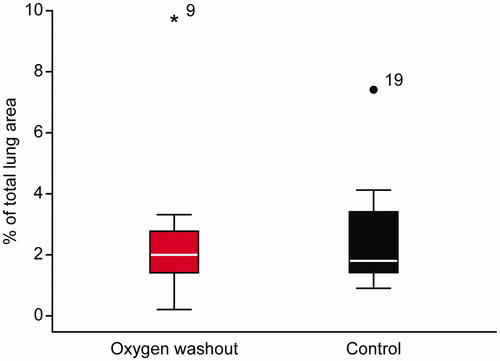
Table 2. Physiological data and duration of anaesthesia in the two study groups, at the time of the second blood gas sample. Both groups were ventilated with an FIO2 of 0.30–0.35.
Figure 4. CT scan of one of the study subjects at the end of surgery. The arrows indicate small areas of atelectasis formation. In this case, 1.9% of the total lung area was affected, and this value corresponded to the median of all subjects in the study.