
Figures & data
Figure 1. The occurrence of intracranial pressure (ICP) > 20 mmHg (in proportion of good monitoring time [GMT]) compared between periods in the highest temperature range (temperature ≥39 °C) and periods in the lower ranges (temperature <39 °C) for individual patients (25 patients with time in both temperature ranges). Each line with dots represents one patient.
![Figure 1. The occurrence of intracranial pressure (ICP) > 20 mmHg (in proportion of good monitoring time [GMT]) compared between periods in the highest temperature range (temperature ≥39 °C) and periods in the lower ranges (temperature <39 °C) for individual patients (25 patients with time in both temperature ranges). Each line with dots represents one patient.](/cms/asset/9fa280cb-fe29-4e7a-abec-b6212f6a8625/iups_a_1319440_f0001_c.jpg)
Figure 2. Predicted values (and 95% CI) from a mixed model including intracranial pressure (ICP) (mmHg) as dependent variable. Upper panel, temperature (°C), compliance (amplitude > or ≤6 mmHg), and the interaction between temperature and compliance as independent variables. Lower panel, temperature (°C), pressure autoregulation (PRx > or ≤0.3) and the interaction between temperature and pressure autoregulation as independent variables.
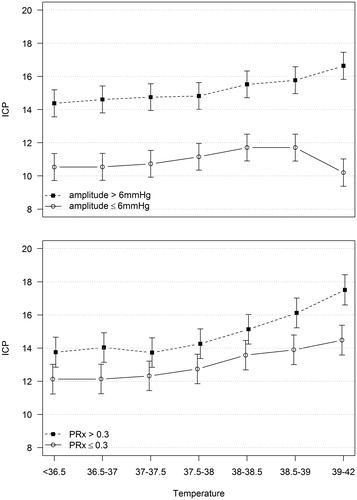
Figure 3. Predicted values (and 95% CI) from a mixed model including BtipO2 (mmHg) as dependent variable and temperature (°C) as independent variable.
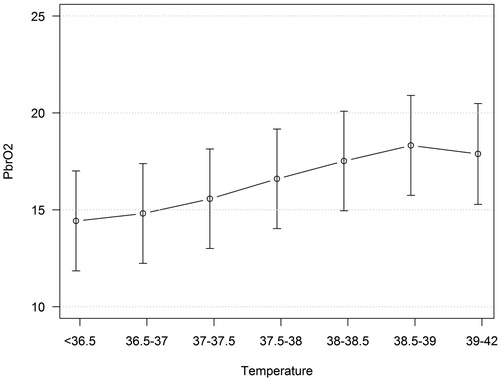
Figure 4. Predicted values (and 95% CI) from mixed models including energy metabolic microdialysis substances (glucose, lactate, pyruvate, and L/P ratio) as dependent variables and temperature (°C) as independent variable. L/P ratio = lactate/pyruvate ratio.
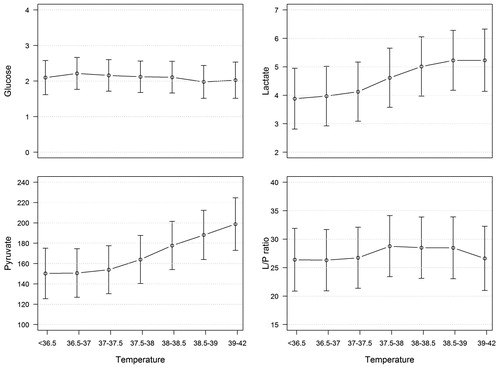
Table 1. The median relative occurrence (proportions of samples) for all individual patients in each microdialysis category (ischemia, metabolic crisis, hyperglycolysis, normal) by temperature. There were 1894 samples without hyperthermia in 28 patients and 661 with hyperthermia in 22 of the 28 patients.