Figures & data
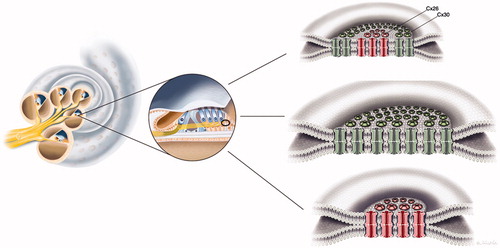
Figure 1. Composition of gap junctions as adapted from Kumar and Gilula (1996) (Citation64). In humans, there are more than 20 isoforms encoded by the gene family, and different cell types may express several connexin isoforms. The possible combinations of hetero-oligomeric connexons seem to be restricted to members of the same subgroup, such as α and β.
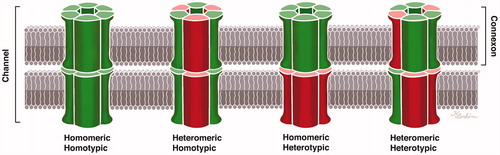
Table 1. Patient data and method of analysis.
Table 2. Antibodies used in this investigation.
Figure 2. Scanning electron microscopy of the cochlear sensory epithelium (organ of Corti) in the low-frequency region. Modified versions of this image were published earlier in the Anatomical Record (Citation65) and with permission in the book Functional Ultrastructure: Atlas of Tissue Biology and Pathology by Margit Pavelka and Jürgen Roth (2015) (Citation66).
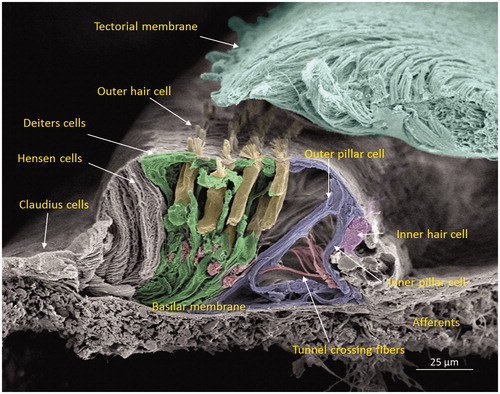
Figure 3. SR-SIM of the inner hair cell (IHC) region in a human cochlea (single optical plane). Cx30 is richly expressed, while Cx26 is hardly detectable. Outer pillar columns display prominent intercellular GJs (filled arrow). Inner pillar feet show large Cx30-positive areas facing the basal lamina (BL). Inset: Confocal micrograph of IHC region. The basal lamina of the epithelium, blood vessels, and neurons are stained for laminin β2. Frames A and B are magnified in insets. A: A few Cx26 GJ plaques are seen among the Cx30-positive GJs. B: An annular GJ with central Cx26-positive domains is seen in the pillar foot. BC: basal cell; E: endolymph; IPC: inner pillar cell; OPC: outer pillar cell.
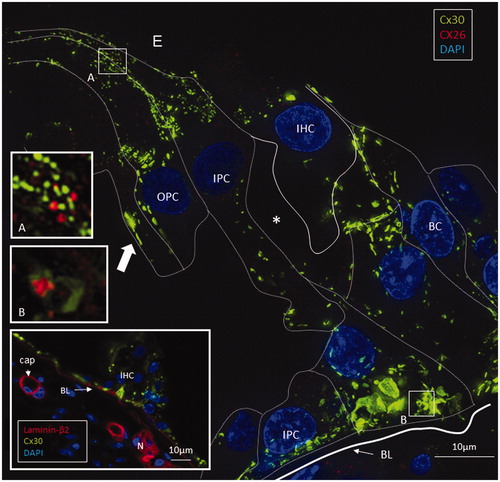
Figure 4. Left: A: Maximum-intensity projection of the Hensen cell (HC) region in the human organ of Corti. Cx30-positive intercellular GJ plaques dominate. Some GJs seem to face the BM (filled arrow). Cx26-expressing GJ plaques are located near the Cx30 plaques (inset top left). Framed areas are magnified in insets A and B. Annular GJ plaques with Cx26 expressed inside can be seen. B: An annular GJ surrounds smaller dots of Cx26 staining. One is superimposed (yellow) on the Cx30 plaque and is shown in higher magnification in B. Right: A 3-D reconstruction of Cx26 (red) and Cx30 (green) protein expression is shown in B. The green signal was reconstructed in surface rendering mode, and the red signal was rendered in spot detection mode using Imaris 8.2 software. The inset demonstrates the GJ complex after clock-wise rotation. A single optical plane with orthogonal sectioning is shown in the Supplementary material. BM: basilar membrane.
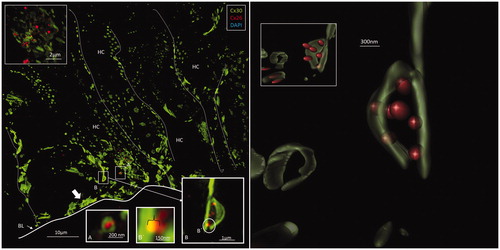
Figure 5. A: Maximum-intensity projection of Cx26 (red) and Cx30 (green) protein expression beneath the outer hair cell region of the human organ of Corti. Cx26 and Cx30 seem to be expressed separately. Cell borders are outlined. Framed areas are magnified in B–E. B and C: Cx26 is mostly expressed as small dots in close association with larger Cx30-positive plaques. D: Superimposed GJs are stained yellow (arrow). E. The Cx30-positive GJ profile (arrow) may reflect degradation and invagination of the channel plaque into the cytoplasm. BM: basilar membrane; DC: Deiters cell.
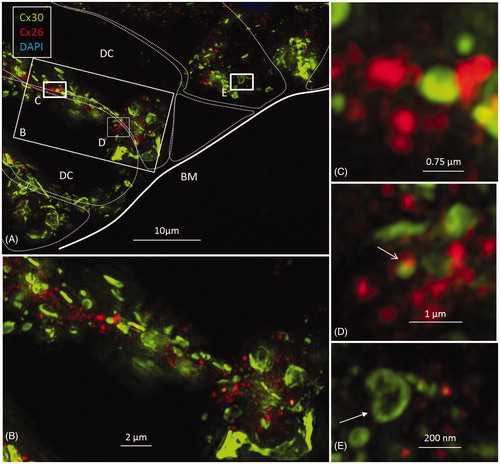
Figure 6. A: SR-SIM of outer sulcus (OS) epithelium and root cells (RCs) at the basal turn of the human cochlea (maximum-intensity projection). Larger Cx30-positive epithelial GJ plaques are seen in the nuclear region (filled arrow). In the basal region of the RCs, large numbers of smaller Cx30-positive plaques are expressed (*). A few Cx26-positive plaques are intertwined among the basal Cx30 plaques (inset of framed area). The sub-epithelial space (SS) also expresses Cx30 in type II fibrocytes. B: Immunofluorescence of laminin/Cx30 co-labeling (*) shows that this network is located between the epithelial root cell processes. C: The corresponding region seen with TEM. BM: basilar membrane; E: endolymph; SP: spiral prominence.
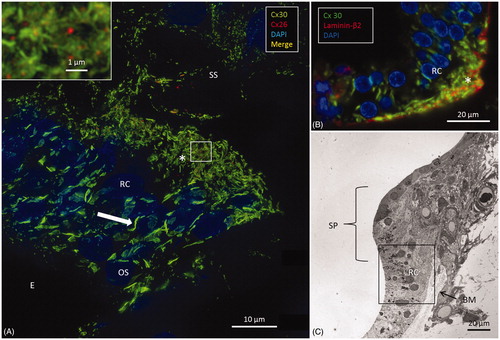
Figure 7. Illustration of gap junction (GJ) plaques in the human organ of Corti. GJ plaques may exist as Cx26 or Cx30 protein homomeric/homotypic aggregates. Some GJ plaques appeared to contain both isotypes. From this experiment, it was not possible to verify whether single plaques consisted of both molecular arrangements (‘hybrid plaque’) or whether separate homomeric GJ plaques were just in close juxtaposition.