Figures & data
Figure 1. Long-term exposure of EndoC-βH1 cells to palmitate increases glucose-induced IAPP secretion and the IAPP to insulin ratio. (A) EndoC-βH1 cells were immunostained for insulin (upper left), IAPP (upper right), glucagon (lower left), and somatostatin (lower right), as well as with DAPI (blue). The cells were then photographed in a Nikon fluorescence microscope using a 40× lens. (B) EndoC-βH1 cells were cultured for 3 days in 5.6 mmol/L glucose +2% BSA with or without 1.5 mmol/L sodium palmitate and 28 mmol/L glucose. The secretion of insulin was analyzed by incubating the cells at 0.5 or 15 mmol/L glucose in a KRBH buffer for 2 h. (C) Cells cultured for 3 days as given in (B) and then incubated for 2 h in a KRBH buffer were used for IAPP secretion experiments. (D) The percentage of secreted IAPP in relation to insulin was calculated from results obtained in (B) and (C). (E) Cells cultured for 3 days as given in (B) were used for insulin content analysis. (F) Cells cultured for 3 days as given in (B) were used for IAPP content analysis. All results are means of duplicates and are expressed as percent of control. Bars represent means ± SEM for 3–4 independent experiments.
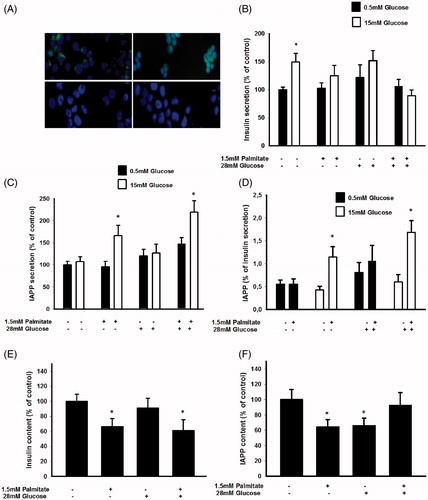
Figure 2. Palmitate increases IAPP mRNA and reduces insulin mRNA. (A) IAPP and insulin mRNA levels were analyzed using real-time RT-PCR. Data represent normalized target gene expression expressed as fold change for IAPP mRNA and insulin mRNA levels of MIN6 cells following palmitate (1.5 mmol/L) exposure for 24 h. (B) EndoC-βH1 cells were cultured for 24 h in the presence of 1.5 mmol/L palmitate and then analyzed for IAPP and insulin mRNA. (C) EndoC-βH1 cells were cultured for 72 h in the presence of 1.5 mmol/L palmitate with and without 28 mmol/L glucose, and then analyzed for IAPP mRNA. (D) EndoC-βH1 cells were cultured for 72 h in the presence of 1.5 mmol/L palmitate with and without 28 mmol/L glucose, and then analyzed for insulin mRNA. Average Ct values; GAPDH: 20.5 ± 0.8, Insulin: 22.4 ± 0.5, IAPP: 26.09 ± 0.7. Bars represent means ± SEM. *p < 0.05 compared with control group. n = 4, in duplicate.
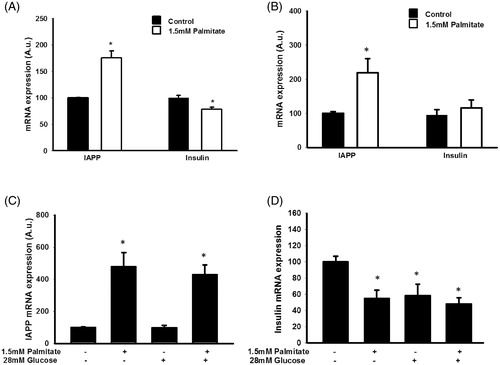
Figure 3. The effect of palmitate on IAPP and insulin mRNA expression is mediated by GPR40 and does not require fatty acid oxidation. EndoC-βH1 cells were cultured for 48 h with or without 1.5 mmol/L palmitate and 1 μmol/L etomoxir and were then analyzed for IAPP (A) and insulin (B) mRNA levels. EndoC-βH1 cells were cultured for 24 h/48 h with or without 1.5 mmol/L palmitate and 1 and 5 μmol/L GW1100 and were then analyzed for IAPP (C) and insulin (D) mRNA levels. Average Ct values; GAPDH: 18.7 ± 0.3, Insulin: 19.4 ± 0.4, IAPP: 21.9 ± 0.2. EndoC-βH1 cells transfected with control/GPR40 siRNA were cultured for 24 h with or without 1.5 mmol/L palmitate and were then analyzed for IAPP (E) mRNA levels. Average Ct values; GAPDH: 18.7 ± 0.9, IAPP: 23.3 ± 1.9. Average Ct values; GAPDH: 24.22 ± 0.2, IAPP: 25.6 ± 0.3. Bars represent means ± SEM. *p < 0.05 compared with control group. #p < 0.05 compared with palmitate treated cells. n = 3, in duplicate.
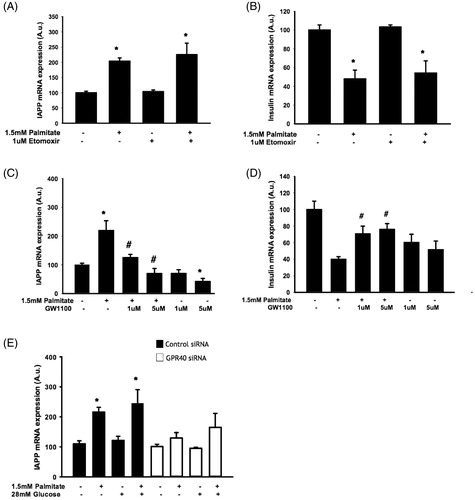
Figure 4. Altered IAPP signaling may underlie enhanced IAPP mRNA expression following exposure to palmitate. EndoC-βH1 cells were cultured for 72 h with or without 1.5 mmol/L palmitate and 6.25 nmol/L IAPP antagonist IAPP 8-37, and were then analyzed for insulin (A) and IAPP (B) mRNA levels. Average Ct values; GAPDH: 18.8 ± 0.2, Insulin: 16.5 ± 0.7, IAPP: 21.6 ± 0.3. Ramp3 (C) and Ramp1 (D) mRNA expression levels were analyzed in EndoC-βH1 cells following culture at 1.5 mmol/L palmitate and/or 28 mmol/L glucose for 72 h. Average Ct values; GAPDH: 19.9 ± 1, Ramp3: 26.8 ± 0.2, Ramp1: 28.5 ± 1.5. Bars represent means ± SEM. *p < 0.05 compared with control group. #p < 0.05 compared with palmitate treated cells. n = 3–4, in duplicate.
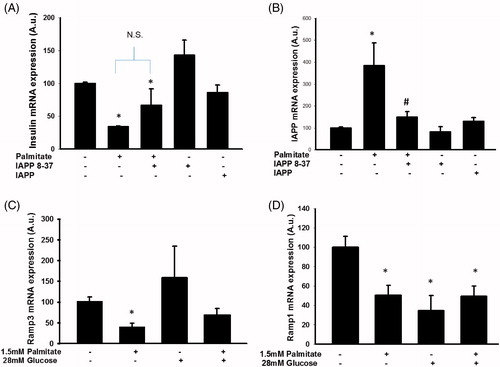
Figure 5. IAPP-induced signaling may require protein kinase D, but not protein kinase C. EndoC-βH1 cells were exposed to 1.5 mmol/L palmitate for 24 h in the presence/absence of different concentrations of a PKC inhibitor (A) and a PKD inhibitor (B), and were then analyzed for IAPP mRNA levels. Bars represent means ± SEM. *Denotes p < 0.05 compared with control group. #Denotes p < 0.05 compared with palmitate treated cells. n = 3, in duplicate.
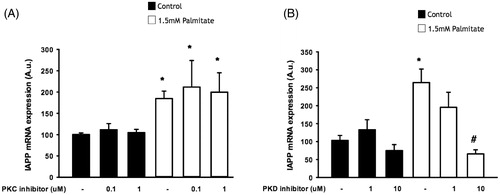
Figure 6. Palmitate reduces the expression of several key transcription factors. EndoC-βH1 cells were cultured for 72 h in the presence of 1.5 mmol/L palmitate with and without 28 mmol/L glucose, and then analyzed for Pdx-1 mRNA (A), MafA mRNA (B), TXNIP mRNA (C), and FoxA2 mRNA (D) by real-time RT-PCR. n = 3, in duplicate. Average Ct values; GAPDH: 20.2 ± 0.7, Pdx-1: 29.6 ± 0.8, MafA: 25.1 ± 0.4, TXNIP: 29.0 ± 0.4, FoxA2: 27.1 ± 0.3. Bars represent means ± SEM. *p < 0.05 compared with control group.
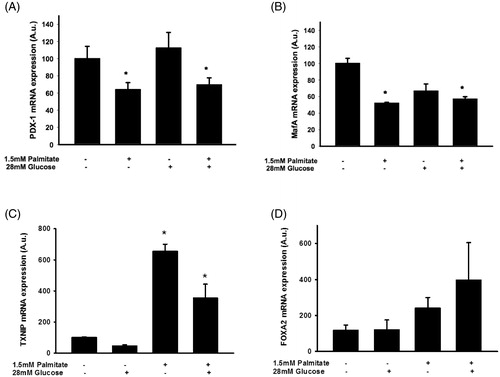
Figure 7. Palmitate and high glucose increase IAPP mRNA, but not insulin mRNA levels. IAPP mRNA levels were analyzed using real-time RT-PCR (A). Data represent normalized target gene expression expressed as fold change for IAPP mRNA levels of human islets following palmitate (1.5 mmol/L) or high glucose (28 mmol/L) exposure for 72 h. (B) Human islets were cultured for 72 h as in (A) and then analyzed for insulin mRNA. Bars represent means ± SEM. *p < 0.05 compared with control group. n = 5, in duplicate.
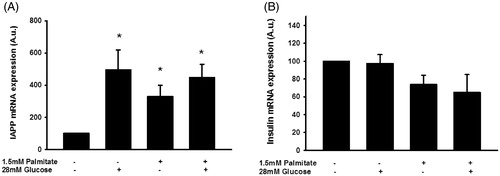
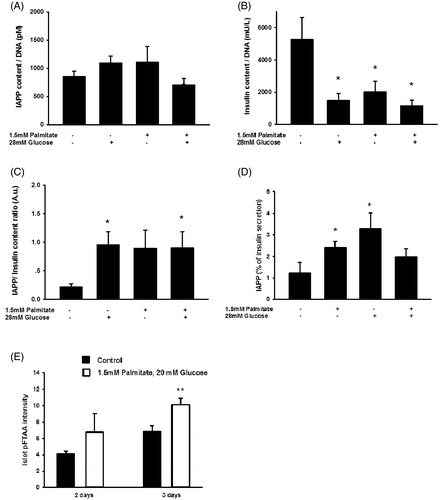
Figure 8. Long-term exposure of human islets to high glucose or high glucose + palmitate. Human islets were cultured for 3 days in 5.6 mmol/L glucose +2% BSA with or without 1.5 mmol/L sodium palmitate and 28 mmol/L glucose, and were used for analysis of IAPP content (A), n = 5. (B) Cells cultured for 3 days as given in (A) and used for analysis of insulin content, n = 5. (C) The ratio of IAPP in relation to insulin was calculated from results obtained in (A) and (B). (D) The secretion of IAPP and insulin from islets cultured for 3 days as given in (A) was analyzed by incubating the cells at 15 mmol/L glucose in a KRBH buffer for 30 min, and the percentage of secreted IAPP in relation to insulin calculated (D), n = 4. (E) Quantification of pFTAA intensity indicate a significant increase in islet amyloid following exposure to high glucose + palmitate for 3 days. All results are means of duplicates. *p < 0.05, **p < 0.01 when comparing versus control using a paired Student's t test. Bars represent means ± SEM for 4–7 independent experiments.