Figures & data
Figure 1. A flow chart of the patients included in the REBUS study.
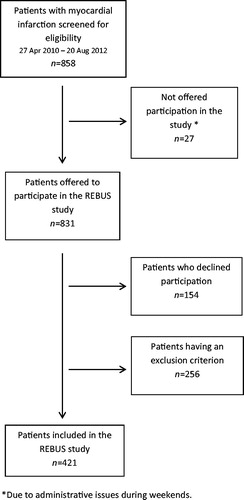
Table 1. Baseline characteristics of the REBUS population and pharmaceutical treatment at hospital discharge. Results describe number of patients (proportion) unless stated otherwise.
Table 2. D-dimer concentrations, thrombin peak concentrations, and ETP given as median (interquartile range).
Table 3. Biomarkers at early follow-up (2–3 weeks after discharge) in relation to baseline characteristics and pharmaceutical treatment at hospital discharge after index event.
Figure 2. Kaplan–Meier estimate for (upper panel) the composite endpoint of all-cause mortality, new myocardial infarction, congestive heart failure, and all-cause stroke; and (lower panel) clinically relevant bleeding events by D-dimer concentration tertiles.
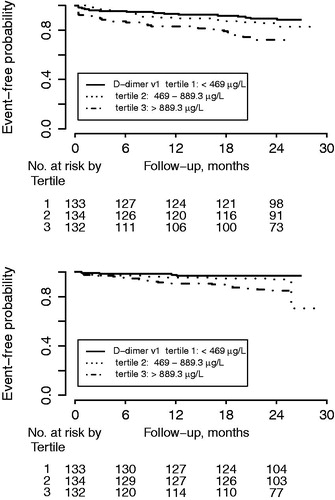
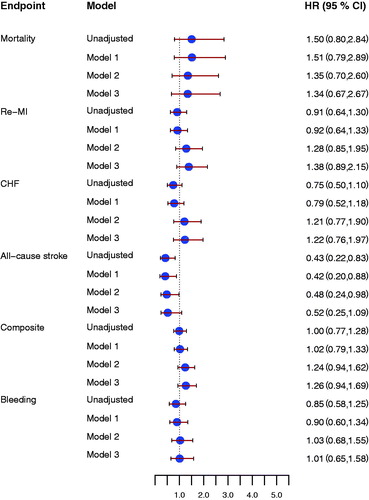
Figure 3. Forrest plot for the effect of D-dimer concentrations at early follow-up for prediction of all-cause mortality, new myocardial infarction (re-MI), congestive heart failure (CHF), all-cause stroke, the composite endpoint, and clinically relevant bleeding event (Bleeding), unadjusted and after adjustment. Model 1 included adjustment for age, sex, hypertension, diabetes, atrial fibrillation, previous congestive heart failure, NSTEMI/STEMI as index event. Model 2 included antithrombotic treatment: aspirin, ADP receptor-blocking agent, and oral anticoagulant treatment at inclusion and at the early follow-up visit. Model 3 included model 1 and model 2. All hazard ratios reflect the effect of a one standard deviation increase.
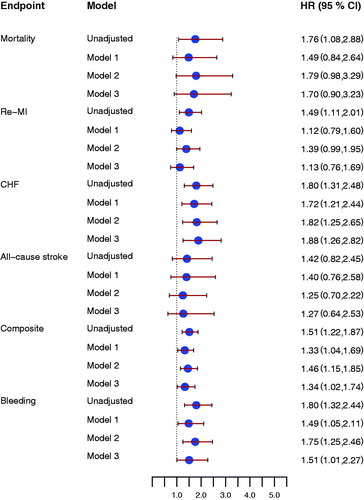
Figure 4. Forrest plot for the effect of thrombin peak at early follow-up for prediction of all-cause mortality, new myocardial infarction (re-MI), congestive heart failure (CHF), all-cause stroke, the composite endpoint, and clinically relevant bleeding event (Bleeding), unadjusted and after adjustment. Model 1 included adjustment for age, sex, hypertension, diabetes, atrial fibrillation, previous congestive heart failure, NSTEMI/STEMI as index event. Model 2 included antithrombotic treatment: aspirin, ADP-receptor blocking agent, and oral anticoagulant treatment at inclusion and at the early follow up visit. Model 3 included model 1 and model 2. All hazard ratios reflect the effect of a one standard deviation increase.
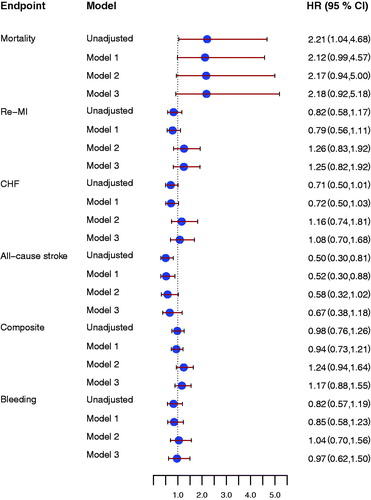
Figure 5. Forrest plot for the effect of endogenous thrombin potential (ETP) at early follow-up for prediction of all-cause mortality, new myocardial infarction (re-MI), congestive heart failure (CHF), all-cause stroke, the composite endpoint and clinically relevant bleeding event (Bleeding), unadjusted and after adjustment. Model 1 included adjustment for age, sex, hypertension, diabetes, atrial fibrillation, previous congestive heart failure, NSTEMI/STEMI as index event. Model 2 included antithrombotic treatment: aspirin, ADP receptor-blocking agent, and oral anticoagulant treatment at inclusion and at the early follow-up visit. Model 3 included model 1 and model 2. All hazard ratios reflect the effect of a one standard deviation increase.