Figures & data
Figure 1. Schematic drawings of structures of the heterodimeric glycoforms of human FSH, LH, and TSH consisting of one α and one β peptide chain. The number of amino acids of the peptide chains is given in parentheses, and the peptide positions of the glycans are indicated.
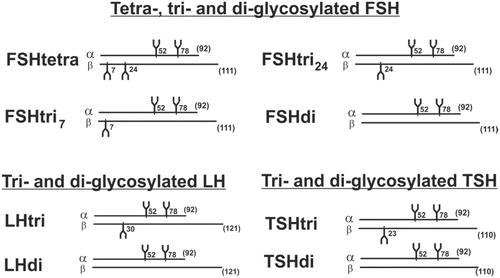
Figure 2. Calibration of Sephadex G-100 gel filtration. The patterns of proteins and hormones in relation to fraction eluted are shown in the left panel. The position where the first protein peak, measured at 280 nm, passed 30% of its top level was given an arbitrary value of 100, and the corresponding position on the slope of the albumin peak was given an arbitrary value of 57. The patterns expressed as size in arbitrary units are shown in the right panel.
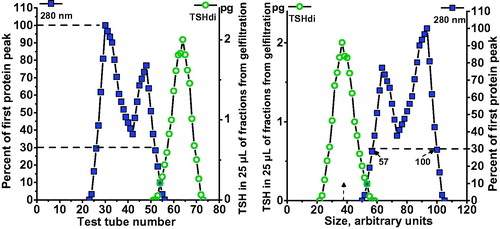
Figure 3. Size of glycoforms of FSH, LH, and TSH in serum, as estimated by gel filtration, in relation to number of anionic monosaccharides (AMS) per molecule, as estimated by electrophoresis. Number of gel filtrations within parentheses. Mean values of glycoform size, in arbitrary units, ranging from 37.9 to 57.4, are shown.
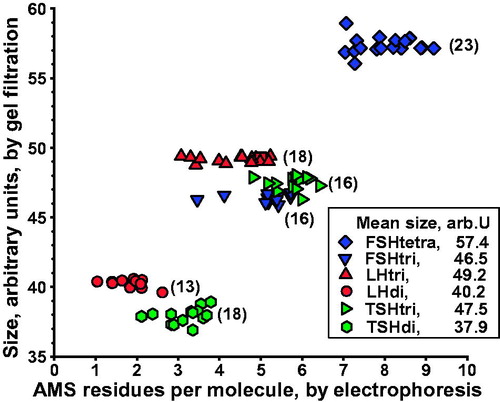
Figure 4. Estimation of percent TSHdi by gel filtration in a serum sample from a 27-year-old woman with hypothyroidism. Distribution of TSH in pg per 25 µL eluate in relation to AMS per molecule by electrophoresis in the lower panel. Results of estimations of size of TSH glycoforms in fractions after electrophoresis in the upper panel, including measurements where TSHdi and TSHtri overlap.
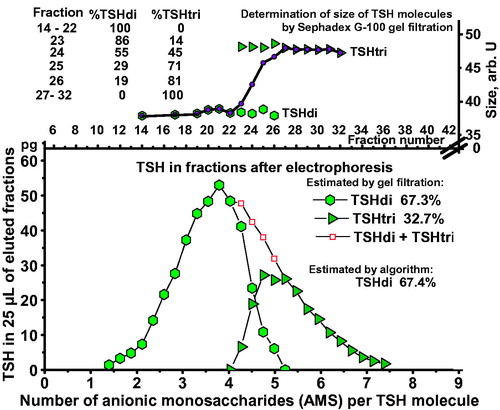
Figure 5. Electrophoresis of TSH in a serum sample from a 34-year-old euthyroid woman. The TSH in femtogram per 25 µL eluate is plotted in peaks in relation to number of AMS per molecule, and the distribution in percent of total amount of TSH eluted is indicated. The distributions of TSHdi and TSHtri from size estimations by gel filtration, and the percent TSHdi estimated by electrophoresis using an algorithm, are shown.
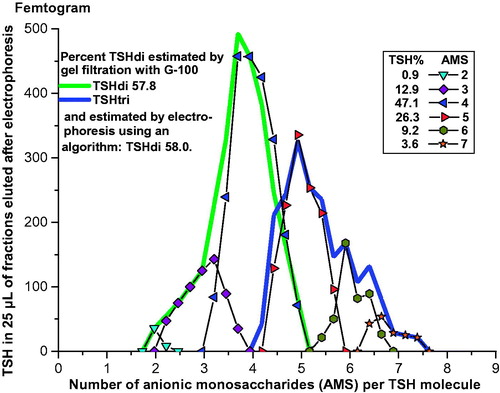
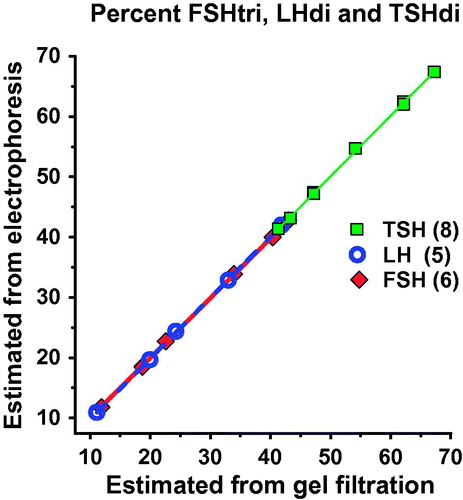
Figure 6. The percent low-glycosylated glycoforms, as estimated by electrophoresis using the three algorithms (see text), was plotted against the corresponding percentage, as estimated by gel filtration. The slopes and the coefficients of correlation were close to 1.