
Figures & data
Table 1. Biochemical and cellular diagnosis and monitoring of acute infections. Which are the possibilities?
Table 2. Human neutrophil lipocalin (HNL).
Figure 1. (a) Serum concentrations of HNL as measured by radioimmunoassay in patients with verified bacterial or viral cause of their acute infection. The horizontal line indicates +3 SD of the upper level of healthy non-infected subjects. Also shown in the figure are the sensitivity and specificity of HNL in the discrimination between bacterial and viral infections. (b) ROC curve analysis of the results of serum HNL and plasma CRP measurements shown in . The areas under the ROC curves (AuROC) are given in the figure.
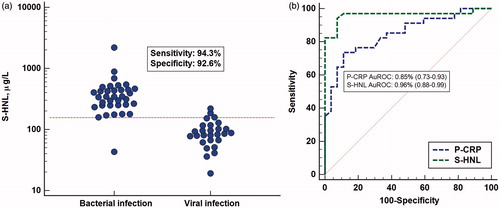
Figure 2. (a) Serum concentrations of dimeric HNL measured by our specific ELISA in patients with acute infections and in healthy non-infected controls. (b) ROC curve analysis of the results of serum HNL and plasma CRP and neutrophil counts in the patients shown in .
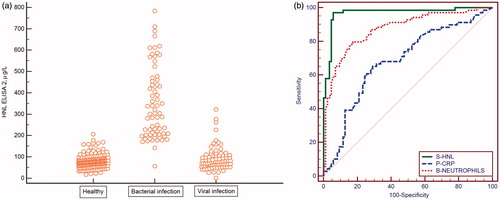
Table 3. The diagnostic specifications of S-HNL, P-CRP, and blood neutrophil counts in the discrimination between acute bacterial and viral infections.
Figure 3. Results of measuring HNL in serum, plasma, or after whole-blood activation. The diagnostic accuracy as defined by specificity + sensitivity/2 is given for the different measurements.
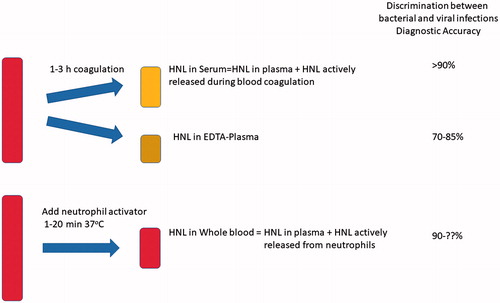
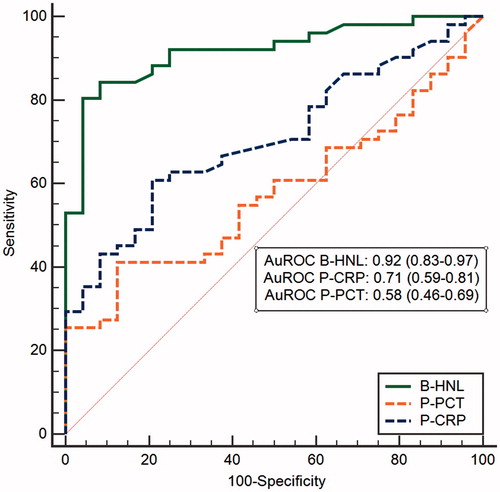
Figure 4. A ROC curve analysis of HNL after whole-blood activation in comparison with plasma concentrations of CRP and procalcitonin. Patients had symptoms of respiratory infections, and their infections were objectively verified by microbiological testing. The AuROCs are given in the figure.
Per Venge and his collaborators have been awarded the €1 million EU prize, the ‘Horizon Prize for better use of antibiotics’. This review summarizes how their combined research efforts have led to a unique solution to reliably detect bacterial infections.

Table 4. Distinction between bacterial and viral causes of various infections as expressed by areas under ROC curves (AuROC).