Figures & data
Figure 1. Culture system setup: ARPE cells cultured on transwell inserts for 5 weeks post-confluence. Retinas were cultured on inserts with the photoreceptor cells facing down, with or without post-confluent ARPE cells. All cultures were exposed to cyclic light for 8 h/day for 3 or 5 days in vitro.
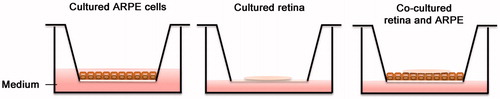
Table 1. Primary antibodies used in immunohistochemical analysis.
Table 2. Details of antibodies used in Luminex measurements.
Table 3. Target-specific primers for factor H, factor I, and 18S.
Figure 2. Immunofluorescent images of human post-confluent ARPE cells double-labeled for the tight junction protein ZO-1 (green) and RPE65 (red, specific for RPE cells) and counterstained with DAPI (blue). Scale bar, 20 μM.
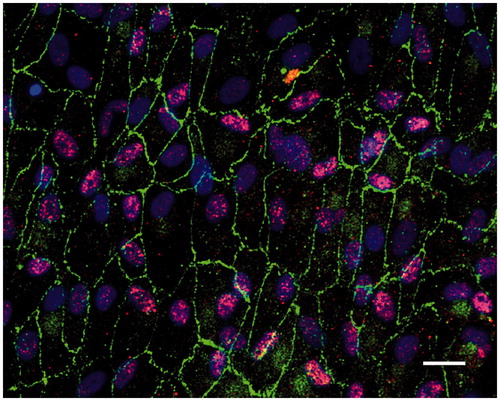
Figure 3. Immunofluorescent images and analysis of cell death by TUNEL assay (green); the cell nuclei are counterstained with DAPI (blue) in non-cultured control retinas (A) and retinas cultured or co-cultured for 3 (B, C) or 5 days in vitro (D, E). Cell death in the outer nuclear layer (ONL) and in the inner nuclear layer (INL) increased over time in the cultured (indicated by arrows in B and D) and co-cultured (indicated by arrows in C and E) retinas when compared to the non-cultured control retinas (A). After 3 days of co-culture with ARPE cells (C, F), cell death was decreased in the retinal specimens when compared to the control retinas (B, F) after 3 days of culture. Cultured retinas retained normal layering post-culture (B–E), shown by separate nuclear layers in the DAPI-stained sections: the outer nuclear layer (ONL), inner nuclear layer (INL), and inner ganglion cell layer (GCL). After culture, the specimens showed holes and injuries, indicated by (*) in the retinal tissue. Occasionally, some TUNEL-labeled ARPE cells were found in the co-culture setup (arrow in ARPE layer in C). Data are expressed as means ± SEM; *P < 0.05; n = 4; scale bars, 20 μM.
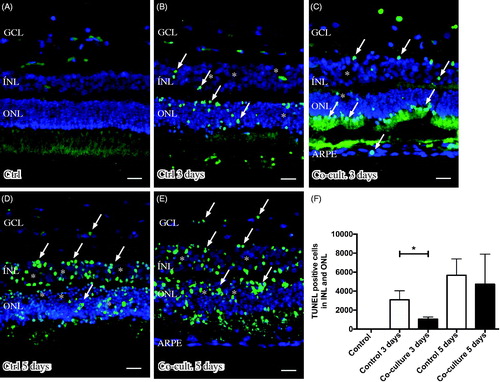
Figure 4. Immunofluorescent staining for C1q (red) and the microglial marker ionized calcium binding adaptor molecule 1 (IBA-1, green) in retinal tissue and ARPE cells. The non-cultured control retina (A) is counterstained with DAPI, and the nuclear layers are indicated: outer, inner, and inner ganglion cell layer (ONL, INL, and GCL), respectively, as well as the outer plexiform layer (OPL). C1q is not shown in non-cultured control retinal cells (A). Resident microglial cells (A) located in the inner retinal tissue (indicated by arrows) and microglial protrusions extend all the way to the OPL (indicated by arrows in the OPL) in the non-cultured control tissue. After 3 days in culture the migrating and active amoeboid-like microglial cells (indicated by arrows) become sparsely C1q-expressing (indicated by *). After 5 days in culture, active microglial cells start to migrate even more, through the OPL and into the outer retinal tissue (D–F). Active microglial cells in retinal tissue cultured for 5 days (D and F) are double-labeled with anti-C1q. There seem to be more active and C1q-positive microglial cells (indicated by *) in the cultured specimens (D, F) than in the co-cultured specimens (E) after 5 days. Scale bars, 20 μM.

Figure 5. Immunofluorescent staining for complement protein 3 (green) in retinal tissue and ARPE cells; nuclei are counterstained with DAPI. Retinal nuclear layers (ONL, INL, and GCL) are indicated. C3-positive labeling is shown in the ARPE cells (C, E, F) and in the outer retina in co-cultured specimens (C, E). Sparse C3-positive ganglion cells are also seen after 5 days of co-culture (*). C3 labeling in the cultured ARPE cells is cytoplasmic and punctate-like, toward the apical portion of the ARPE cells (indicated by arrows in F). Scale bars, 20 μM.
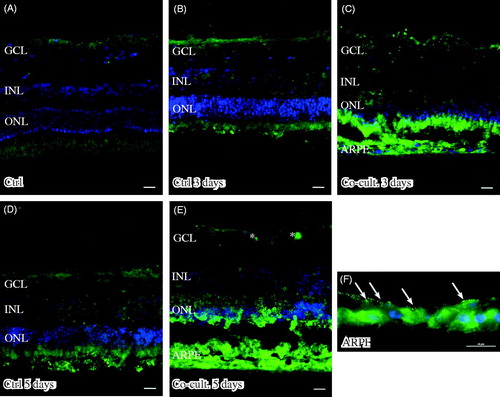
Figure 6. Immunofluorescent staining for complement protein 4 (green) in retinal tissue and ARPE cells; nuclei are counterstained with DAPI. Retinal nuclear layers (ONL, INL, and GCL) are indicated. C4-positive labeling is seen only in the ARPE cells (C, E, F). C4 labeling in the cultured ARPE cells is cytoplasmic, and C4 shows a more intense expression on the basal part of the ARPE cells (C, E, F) (indicated by arrows in F). Sparse C3-positive ganglion cells are obvious in the cultured control retinal tissue after 3 and 5 days of culture (indicated by * in the GCL). Scale bars, 20 μM.
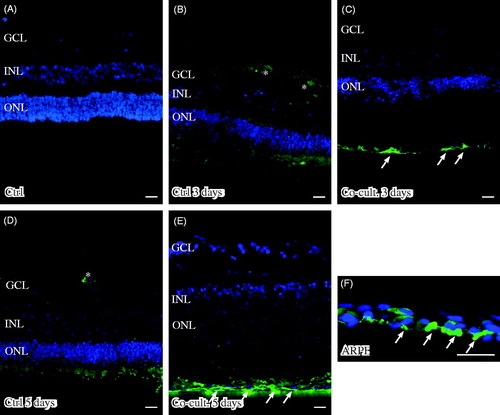
Figure 7. Immunofluorescent staining for calbindin (green) and the soluble terminal complement complex (sC5b-9, red) in retinal tissue and ARPE cells. Retinal nuclear layers (ONL, INL, and GCL) are indicated. Anti-calbindin antibody labels ganglion, horizontal, and amacrine cells in the retinal tissue (A–E). sC5b-9 (indicated by *) labels blood vessels in non-cultured control retinas (A), in retinas cultured for 3 days (B), and in retinas co-cultured for 3 days (C). After retinal culture or co-culture for 3 or 5 days, ganglion cells are sparsely positive for sC5b-9 (indicated by arrows in B–E). In co-cultured specimens, sC5b-9 seems to coincide with calbindin-positive cells in the INL. Scale bars, 20 μM.
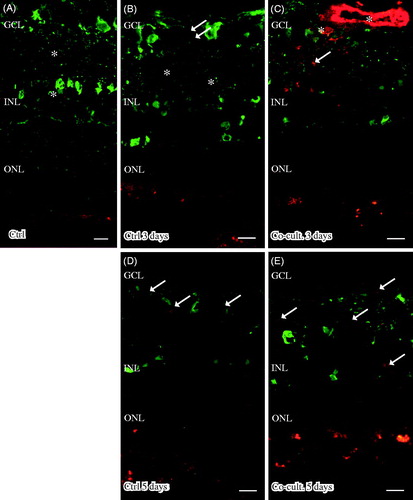
Figure 8. Immunofluorescent staining for glial fibrillary acidic protein (GFAP; green) and the complement anaphylatoxin receptor C5aR (red) in retinal tissue and ARPE cells. Retinal nuclear layers (ONL, INL, and GCL) are indicated. C5aR shows endogenous expression in the retinal tissue, in the inner retina GCL, INL, and the plexiform layers (IPL and OPL). C5aR (indicated by arrowheads) labels Müller cell nuclei (A–D, F). GFAP labels astrocytes (A–E) and major Müller cells in the retinal tissue (A–F). In the cultured gliotic retinas, Müller cells show increased GFAP staining that is more intense after 5 days (D), and GFAP is expressed up to the Müller cells’ distal processes, stretching to the external limiting membrane in the outer retina (indicated by *). Also, GFAP-positive filaments surround the C5aR-positive Müller cell nuclei in the INL (E and F). Scale bars, 20 μM.
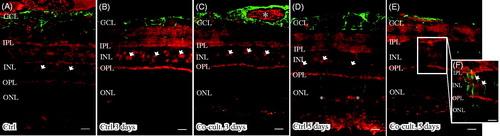
Figure 9. Luminex analysis of complement components (C1q, C3, C4BP, CFH, and CFI) in conditioned media from post-confluent ARPE cells (green line) and cultured retinas (pink line) as well as co-cultured retinas (blue line), cultured for 0–5 days. Cell culture medium (black line) was also included; none of the investigated complement components was found in this medium. C1q secretion from retinal cultures cultured for 5 days (A) was higher than that from ARPE cells cultured alone or ARPE cells co-cultured with porcine retinas. C3 was secreted from ARPE cells and from co-cultures (B). The regulators C4BP (C), CFH (D), and CFI (E) were all secreted from the ARPE cells and the co-cultures, but none of the regulators was secreted in any major amount from the cultured control retinas. There was a temporal decrease in the CFI secretion after 3 days (E) when compared to the co-cultured specimens. Data are expressed as means ± SEM; *P < 0.05; **P < 0.01; n = 4.
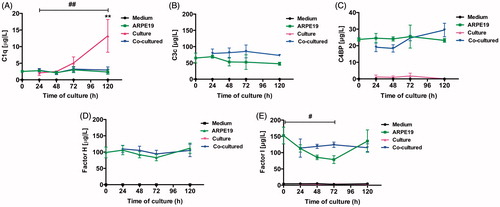
Figure 10. Real-time quantitative PCR analysis of the alternative pathway regulators (A) complement factor H (CFH) and (B) complement factor I (CFI): normalized Ct values in young control ARPE cells (dashed bars), post-confluent cultured ARPE cells (white bars), and post-confluent co-cultured ARPE cells (black bars). After 3 days, there was a significant increase in CFH mRNA expression in the post-confluent ARPE cells as compared to the young cultured ARPE cells. After 5 days, the co-cultured ARPE cells showed an increase in CFH mRNA expression when compared to the control cells. CFI was significantly increased in post-confluent ARPE cells cultured for an additional 3 or 5 days when compared to the young control ARPE. The amount of CFI mRNA in co-cultured ARPE cells was significantly increased after 5 days in culture when compared to the control values. Data are expressed as means ± SEM; *P < 0.05; n = 4).
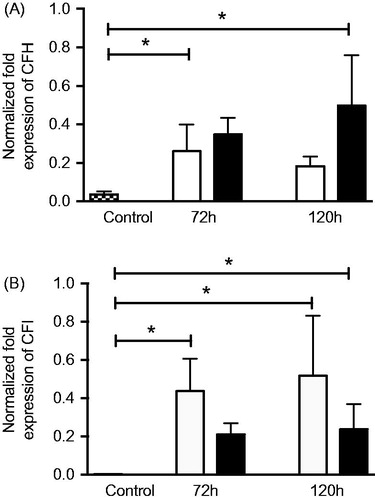
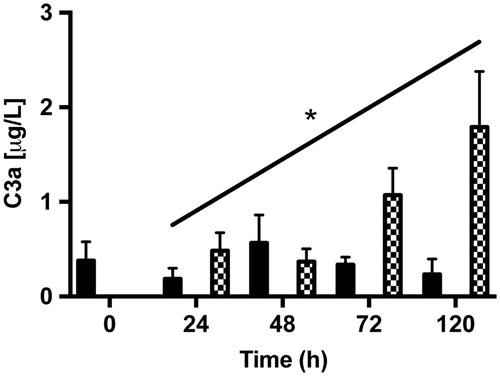
Figure 11. ELISA assays of fluid-phase anaphylotoxin C3a in conditioned medium from post-confluent ARPE cells (black bars), cultured retinas (white bars), and co-cultures (dashed bars). After 5 days in culture, there was a trend toward a slight increase in C3a from the co-cultured specimens over time in culture. C3a could not be detected in the cultured retinas. Data are expressed as means ± SEM; *P < 0.05; n = 4.