Figures & data
Table 1. Cytogenetic characteristics of 156 AML bone marrow samples for the miRNA array.
Table 2. Clinical characteristics of 79 AML patients for the detection of miR-130a.
Figure 1. Hierarchical clustering of miRNA expression in a selected group of 54 AML patients utilizing 22 twofold differentially expressed miRNAs. MiRNA levels are shown as a heat map. (a) t(8;21); (b) inv(16): (c) t(15;17); (d) NK.
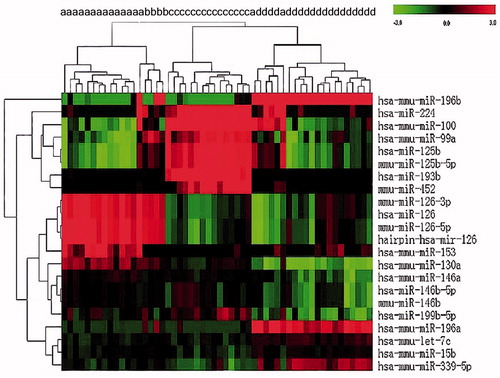
Figure 2. (A) Rq-PCR results of miR-130a expression in 16 AML cell lines, which reveal that the KASUMI-1 and SKNO-1 cell lines with t(8;21) and the ME-1 cell line with inv(16) had much higher expression of miR-130a when compared with other AML cell lines. (B) Rq-PCR results of miR-130a expression in 79 patients with AML and 10 healthy controls, which show that expression of miR-130a was significantly higher in primary BM samples with t(8;21) than in those with other cytogenetic characteristics and normal controls. (C) Rq-PCR results of miR-130a expression in 10 AML patients with t(8;21). The results demonstrate that all patients had much higher miR-130a expression level at diagnosis than at complete remission (CR). (D) Rq-PCR results of miR-130a expression in two AML patients with t(8;21). The results reveal that expression of miR-130a decreased significantly at the time of CR compared with that detected at diagnosis, contrasting with a sharp increase in the relapsed sample (***P < 0.01). (E) Rq-PCR results of miR-130a expression in three AML patients with t(8;21). The results show that expression of miR-130a decreased gradually both at the time of partial remission (PR) and CR compared with that detected at diagnosis. (F) Expression of miR-130a in AML patients according to mutational status of KIT. The results show that patients with KIT mutation had much higher overexpression of miR-130a (P = 0.028). (G) Event-free survival (EFS) of AML patients with t(8;21) in this study. The results reveal that t(8;21) patients with lower miR-130a expression had slightly better EFS compared with those had higher miR-130a expression (P = 0.057). (H) Overall survival (OS) of AML patients with t(8;21) in this study. The results reveal that expression level of miR-130a showed no effect on OS of t(8;21) AML (P = 0.373).
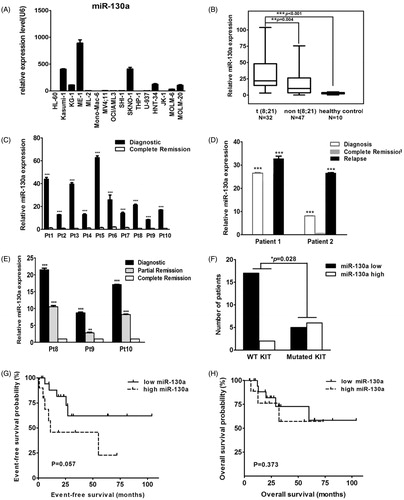
Figure 3. (A) Western blot results of expression of AML1/ETO in SKNO-1 cells. The results indicate that expression of the AML1/ETO fusion protein decreased significantly in SKNO-1 cells transfected with siRNA targeting AML1/ETO. SiAGF1 was a siRNA targeting the AML1/ETO fusion gene. SiGL2 was a siRNA targeting P pyralis luciferase, which was used as a negative control siRNA in this study. (B) Heat map of the miRNA array of SKNO-1 cells transfected with the AML1/ETO siRNA and the control siRNA. Levels of 24 differentially expressed miRNAs between the two groups are shown as a heat map. Two paired miRNA samples collected at two independent knockdown experiments were used. (C) Change of expression of four miRNAs in SKNO-1 with and without AML1/ETO knockdown. The results show increased expression of miR-10a, contrasting with decreased expression of miR-129 and miR-130a in SKNO-1 transfected with AML1/ETO siRNA when compared to controls. Standard errors are indicated. (D) Western blot results of expression of AML1/ETO in HeLa cells. The results indicate that AML1/ETO fusion protein was successfully overexpressed in HeLa cells transfected with the AML1/ETO plasmid compared with that transfected with the control vector. (E) Change of expression of four miRNAs in HeLa cells with and without AML1/ETO overexpression. The results show decreased expression of miR-10a, but increased expression of miR-129 and miR-130a in HeLa with AML1/ETO overexpression. Standard errors are indicated. (F, G, H) Expression of miR-10a, miR-100, and miR-129 in AML cell lines. The results demonstrate that these miRNAs are not uniquely upregulated or downregulated in AML cell lines with the t(8;21) translocation (KASUMI-1 and SKNO-1).
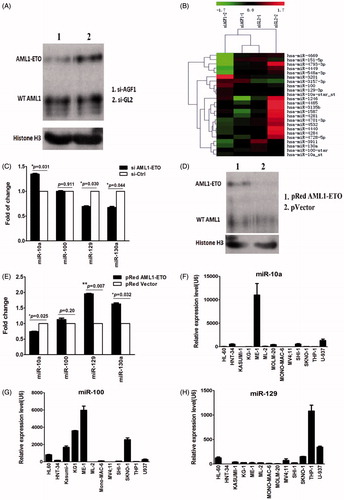
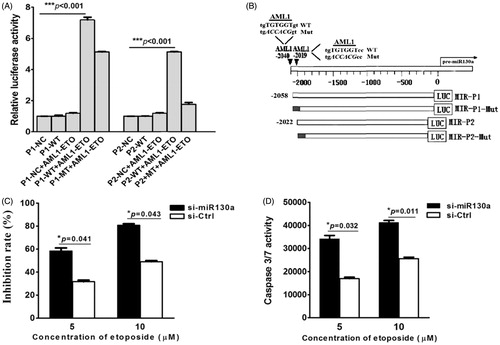
Figure 4. (A) Luciferase reporter gene assay. The results show that AML1/ETO could activate expression of vector containing the wild-type P1, the P1 mutant, and the wild-type P2, which could not activate the P2 mutant of the 5’-UTR sequence of pre-miR-130a. (NC = negative control luciferase reporter plasmid; P1-WT, P2-WT = luciferase plasmid containing the wild-type P1 or P2 sequence; P1-Mut, P2-Mut = luciferase plasmid containing the mutated P1 or P2 sequence; black = mutated regions). (B) Schematic structure of the luciferase plasmid construct. The results represent the average of three independent evaluations. (C) Growth inhibition by etoposide (5 μM) of transfected SKNO-1 cells after 24 h treatment. The results reveal that growth of SKNO-1 cells was obviously inhibited by etoposide compared to that transfected with the negative control miRNA inhibitor. (D) Caspase 3/7 activity in transfected SKNO-1 cells treated with different concentrations (5 μM and 10 μM) of etoposide for 24 h. The results show that the activity of caspase 3/7 increased significantly in SKNO-1 cells transfected with the miR-130a inhibitor compared to that transfected with the negative control inhibitor (*P = 0.032 and *P = 0.011, respectively).