Figures & data
Figure 1. Logit of mortality risk with 95% confidence intervals versus BMI and WC, adjusted for each other.
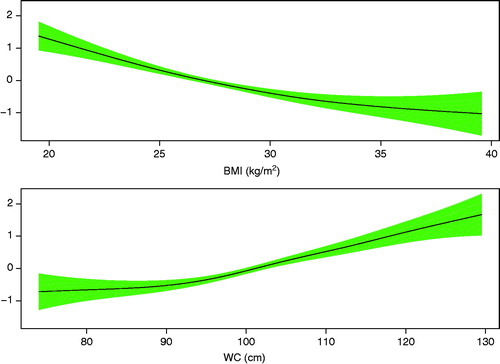
Table 1. Characteristics of the analysis sample, mean (±SD) or number (%).
Table 2. Associations between BMI and WC, and all-cause mortality (from one year after hospital discharge), n = 14,224 (721 deaths).
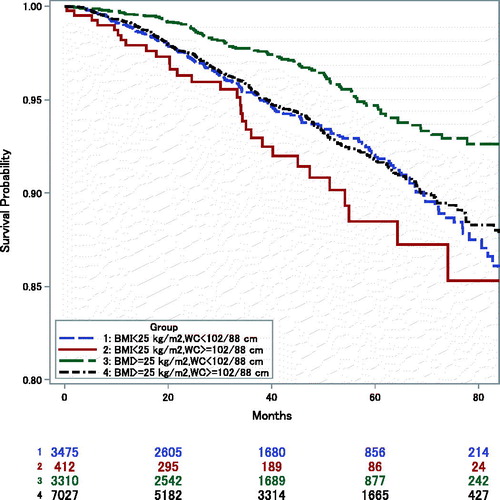
Figure 2. Kaplan–Meier survival estimates (from one year after hospital discharge) by anthropometric groups: Low-BMI, Low-WC = BMI<25 kg/m2, WC<102 (male)/88 (female) cm; Low-BMI, High-WC = BMI<25 kg/m2, WC≥102/88 cm; High-BMI, Low-WC = BMI≥25 kg/m2, WC<102/88 cm; High-BMI, High-WC = BMI≥25 kg/m2, WC≥102/88 cm.