
Figures & data
Table 1. Correlations (Spearman’s rho) between dependent variables.
Table 2. Sociodemographic background in relation to pornography consumption at follow-up.
Figure 1. Interaction between sex and ethnic background in relation to frequency of pornography consumption. Blue bars = boys; green bars = girls. For further information about the interaction, please see .
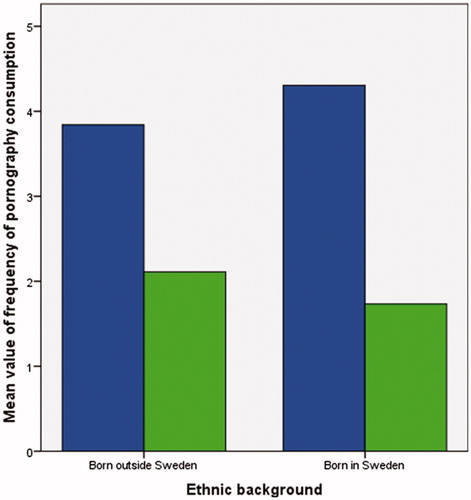
Table 3. Mean value pornography consumption, depressive symptoms, and psychosomatic symptoms at baseline.
Table 4. Main and interaction effects in relation to pornography consumption at follow-up (adjusted R2 = 0.689).
Table 5. Main and interaction effects of psychosomatic symptoms at follow-up in relation to pornography consumption (adjusted R2 = 0.254).
Figure 2. Interaction between ethnic background and pornography consumption in relation to depressive symptoms. Blue bars denote users with lower pornography consumption at follow-up, whereas green bars denote higher consumption. For further information about the interaction, please see .
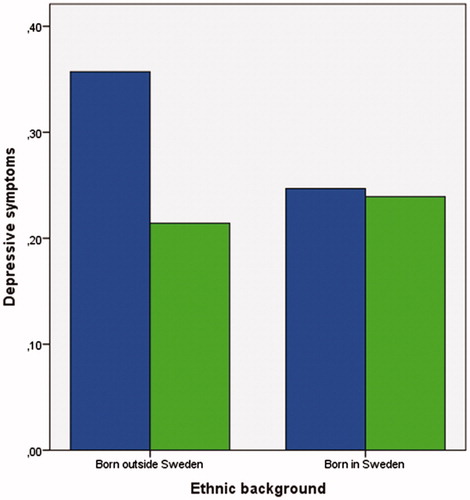
Table 6. Main and interaction effects of depressive symptoms at follow-up in relation to pornography consumption (adjusted R2 = 0.122) analyzed with a general linear model and complementary statistics in a Poisson regression.