Figures & data
Figure 1. Transmission electron microscopy of seminal prostasomes. Inserts show enlarged the typical appearance of seminal prostasomes from normozoospermic men (N) (no protein in the background) and seminal prostasomes from oligozoospermic men (O) (protein material in the background with vesicles seemingly immersed).
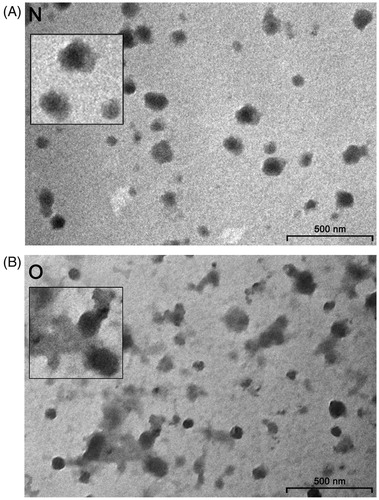
Figure 2. Protein composition of seminal prostasomes. Seminal prostasomes isolates were resolved on 10% SDS-PAGE under reducing and denaturing conditions and stained with silver or transferred onto a membrane and subjected to immuno-blot. A: A representative total protein pattern of seminal prostasomes with three characteristic bands (Citation12) in the region of 90–150 kDa (asterisk). B: CD63, an EVs-associated marker gave characteristic smeared band above 31 kDa. The numbers indicate the position of molecular mass standards (kDa). (N = seminal prostasomes from normozoospermic men; O = seminal prostasomes from oligozoospermic men).
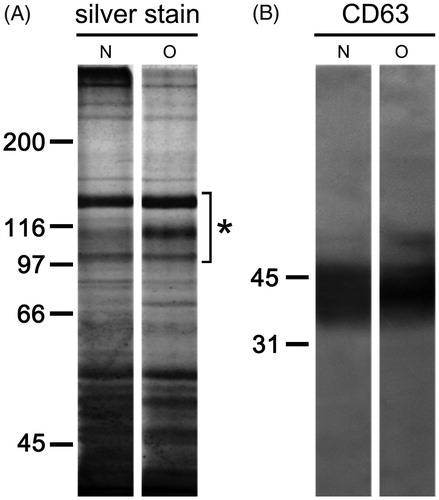
Figure 3. Surface glycosylation of seminal prostasomes: ion-exchange chromatography. Two pools of each group of isolates were subjected to ion-exchange chromatography on DEAE A-50 column eluted with 0.05 M Tris–HCl buffer, pH 7.6 (a), containing: 0.05 M NaCl (b); 0.1 M NaCl (c); 0.2 M NaCl (d), and 1 M NaCl (e). Elution was monitored by Sambucus nigra agglutinin (SNA) and concanavalin A agglutinin (ConA) binding reactivity. N pool 1 (thick line) and N pool 2 (thin line) had protein concentration 313 µg/mL and 473 µg/mL, respectively. O pool 1 (thick line) and O pool 2 (thin line) had protein concentrations of 318 µg/mL and 581 µg/mL, respectively. Asterisk denotes CD63-positive fractions as determined by dot blot. (N = seminal prostasomes from normozoospermic men; O = seminal prostasomes from oligozoospermic men).
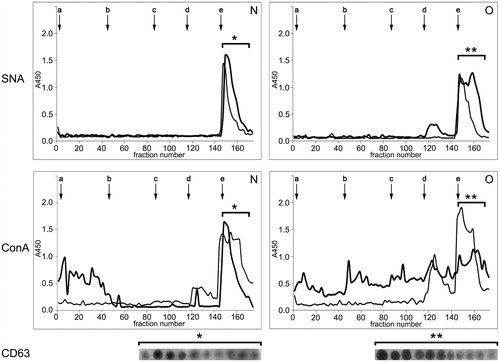
Figure 4. Surface glycosylation of seminal prostasomes: lectin- and immune-transmission electron microscopy. A: Lectin-TEM using SNA. Inserts show enlarged characteristic pattern of SNA-reactivity to each sample group. B: Lectin-TEM using ConA. Inserts show enlarged characteristic pattern of ConA-reactivity to vesicles in each sample group. In O, staining of some proteinaceous material was also observed (arrowheads). C: Immune-TEM using anti-galectin-3 antibodies. Inserts show enlarged characteristic pattern of anti-gal-3-reactivity to each sample group. Micrographs show most characteristic patterns obtained. Although differences in the reactivity of particular vesicles could be noticed, it does not affect the general reactivity of the sample (as in IEC when taking all vesicles into account). (N = seminal prostasomes from normozoospermic men; O = seminal prostasomes from oligozoospermic men).
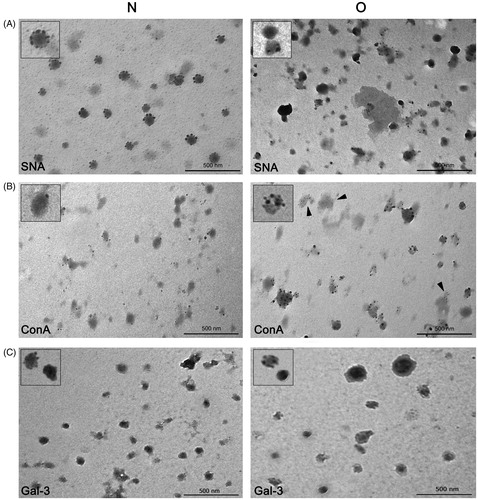
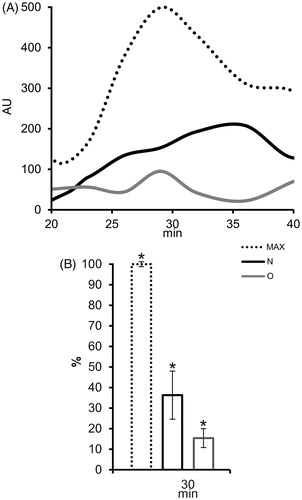
Figure 5. The effect of seminal prostasomes on reactive oxygen species (ROS) production in polymorphonuclear neutrophils (PMN). A: Kinetics of ROS production in PMN after activation with 12-myristate-13-acetate phorbol ester (PMA) alone (MAX) or in the presence of charge-resolved population of N and O, eluted with 1 M NaCl. B: Comparison of ROS production (%) in PMN after 30 min of PMA addition, alone or in the presence of charge-resolved population of N and O, eluted with 1 M NaCl shows statistically significant decrease for all. The results are mean values of three experiments, and vertical bars present percent of standard deviation. Asterisk (*) indicates P < 0.05. (AU = arbitrary chemiluminescence units; N = seminal prostasomes from normozoospermic men; O = seminal prostasomes from oligozoospermic men).