Figures & data
Figure 1. Layout of study. The gestational day (GD) when the different pregnancies are interrupted is displayed in the first column. The number and types of pregnant rats (CD: control diet; HFD: high fat diet) are displayed in the second column. The samples analyzed are displayed in the third column. T1, 2 and 3 denote Tables 1–3, whereas F2, 3, 4 and SF2 denote Figures 2–4 and Supplementary Figure 2 available online.
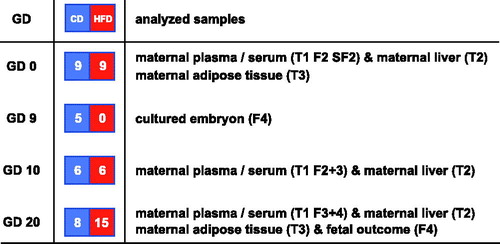
Table 1. Plasma components/fatty acid concentrations in day-0, day-10, day-20 pregnant rats on control diet (n = 9, 6, 8), or high-fat diet (n = 9, 6, 15).
Figure 2. (A) Serum branched chain amino acid concentration (mmol/l) of pregnant rats on control diet (CD, blue bars), or high fat diet (HFD, red bars) on gestational day 10 (n = 6 in both CD and HFD groups). Mean ± SEM. * = P < 0.05 for CD vs. HFD. (B) Serum leptin concentration (ng/ml) on gestational day 0 and 10 of pregnant rats on CD (n = 9 and 6, blue bars), or HFD (n = 9 and 6, red bars). Mean ± SEM. * = P < 0.05 for CD vs. HFD. (C) Serum adiponectin concentration (μg/ml) on gestational day 0 and 10 of pregnant rats on CD (n = 9 and 6, blue bars), or HFD (n = 9 and 6, red bars). Mean ± SEM. (D) Serum resistin concentration (ng/ml) on gestational day 0 and 10 of pregnant rats on CD (n = 9 and 6, blue bars), or HFD (n = 9 and 6, red bars). Mean ± SEM. * = P < 0.05 for CD vs. HFD.
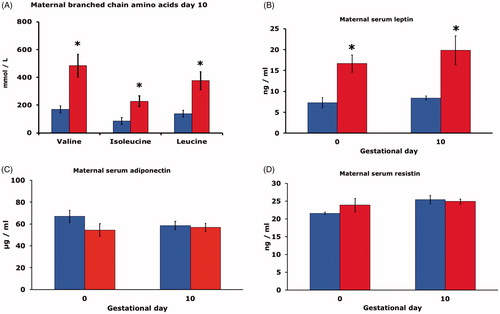
Table 2. Liver lipid/liver fatty acid concentrations in day-0, day-10, day-20 pregnant rats on control diet (n = 9, 6, 8), or high-fat diet (n = 9, 6, 15).
Table 3. Adipose tissue fatty acid concentration (mg/g) in day-0 or day-20 pregnant rats on control diet (n = 9, 8), or high-fat diet (n = 9, 15).
Figure 3. (A) Gene expression of CuZnSOD, MnSOD and Gpx1 in adipose tissue of pregnant rats on control diet (CD, n = 8, blue bars), or high fat diet (HFD, n = 15, red bars) on gestational day 20. Mean ± SEM. * = P < 0.05 for CD vs. HFD. (B) Gene expression of TNF-α, IL-6 and IL-10 in adipose tissue of pregnant rats on CD (n = 8 blue bars), or HFD (n = 15, red bars) on gestational day 20. Mean ± SEM. * = P < 0.05 for CD vs. HFD. (C) Gene expression of adiponectin and resistin in adipose tissue of pregnant rats on CD (n = 8, blue bars), or HFD (n = 15, red bars) on gestational day 20. Mean ± SEM. * = P < 0.05 for CD vs. HFD. (D) Gene expression of CuZnSOD, MnSOD and Gpx1 on gestational day 10 in embryos of six pregnant rats on CD (blue bars, n = 30 embryos), or in embryos of six pregnant rats on HFD (red bars, n = 30 embryos). Mean ± SEM. * = P < 0.05 for CD vs. HFD.
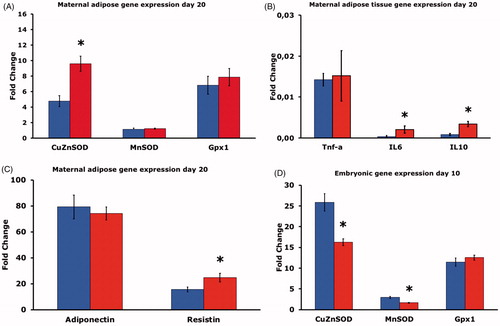
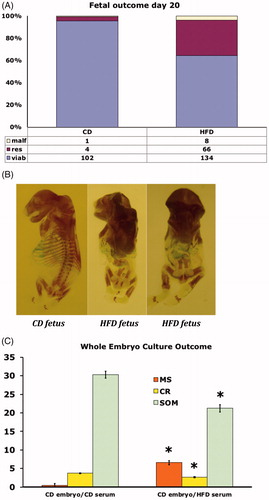
Figure 4. (A) Fetal outcome of rats on control diet (CD, n = 8, left bar), or high fat diet (HFD, n = 15, right bar) on gestational day 20. Number and proportion of malformed (malf), resorbed (res) and viable (viab) fetuses. (B) Alizarin Red and Alcian Blue stained malformed fetuses from rats on control diet (CD) (left fetus), or high fat diet (HFD) (middle and right fetus). All fetuses show lack of tail, and the two HFD-fetuses (middle and right panel) also demonstrate decreased general ossification. (C) Outcome in CD embryos cultured for 48 h in serum from pregnant rats on either control diet (CD), or in serum from rats on high fat diet (HFD). 20 CD embryos were cultured in CD serum, and 20 CD embryos were cultured in HFD serum. Malformation score (MS), crown-rump length (CR) and somite number (SOM). Mean ± SEM. * = P < 0.05 for CD vs. HFD.