Figures & data
Table 1. Antibodies used in the present investigation.
Figure 1. Scanning electron microscopy of the human organ of hearing (organ of Corti). Maximum resolution was to 2 nm. Different structures have been color-labeled for clarity (neurons, yellow; hair cell, red; basilar membrane, green; tectorial membrane, grey; pillar and Deiters cells, light green). Afferent synaptic terminals reach the basal pole of the IHCs. Framed area shows the basal poles where neurons innervate the OHCs. The tunnel nerve fibers are efferents from the medial olivo-cochlear portion innervating the OHCs. Efferents via the lateral olivo-cochlear portion reach the IHC synaptic terminals. Afferent fibers to the OHCs cross the tunnel basally and cannot be seen here. (A different version of this image was published earlier in Anatomical Record [Rask-Andersen et al. 295:1791–1811 (2012)]. Permission for reuse was granted. Permission to reuse : License Number 4633510242533; License Date: 21 July 2019; Licensed Content Publisher: John Wiley and Sons; Licensed Content Publication: The Anatomical Record: Advances in Integrative Anatomy and Evolutionary Biology).
![Figure 1. Scanning electron microscopy of the human organ of hearing (organ of Corti). Maximum resolution was to 2 nm. Different structures have been color-labeled for clarity (neurons, yellow; hair cell, red; basilar membrane, green; tectorial membrane, grey; pillar and Deiters cells, light green). Afferent synaptic terminals reach the basal pole of the IHCs. Framed area shows the basal poles where neurons innervate the OHCs. The tunnel nerve fibers are efferents from the medial olivo-cochlear portion innervating the OHCs. Efferents via the lateral olivo-cochlear portion reach the IHC synaptic terminals. Afferent fibers to the OHCs cross the tunnel basally and cannot be seen here. (A different version of this image was published earlier in Anatomical Record [Rask-Andersen et al. 295:1791–1811 (2012)]. Permission for reuse was granted. Permission to reuse Figure 1: License Number 4633510242533; License Date: 21 July 2019; Licensed Content Publisher: John Wiley and Sons; Licensed Content Publication: The Anatomical Record: Advances in Integrative Anatomy and Evolutionary Biology).](/cms/asset/a32bfaa3-5c9c-41a0-bc44-d7aad389eca9/iups_a_1653408_f0001_c.jpg)
Table II. Expression of Na/K-ATPase subtypes.
Figure 2. Confocal microscopy and composite micrograph showing the expression of Na/K-ATPase β1 in a mid-modiolar sections of an adult human cochlea. The interrupted line shows position of Reissner’s membrane. There is a strong expression of Na/K-ATPase at the spiral prominence, stria vascularis, and the plasma membranes of the spiral ganglion cell bodies. The ganglion cells express connexin30 (insets). Framed area in upper inset is shown in higher magnification in lower left inset. Cochlear turns are denoted by 1–3. Fibrocyte types in the lateral wall are marked I–V. Framed areas are magnified in and Supplementary Figure 2C (available online).
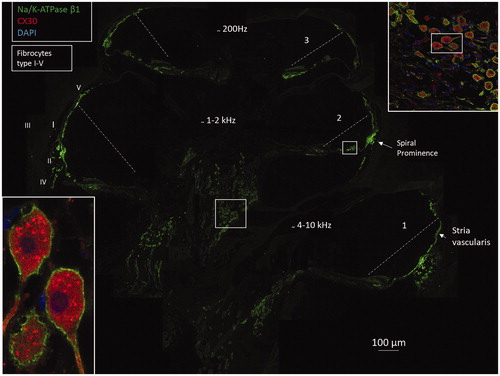
Figure 3. A: Confocal microscopy of Na/K-ATPase β1 expression in neurons of the human organ of Corti. The basolateral membranes of Hensen cells (HCs) are positive as well. The Corti tunnel is partly collapsed. Neurons beneath the IHC, outer spiral bundle (OSB), and tunnel spiral bundle show intense expression of the β1 isoform. B: Scanning electron microscopy of an OSB beneath the OHC. Framed area is magnified in C. Inset in D shows β1 expression of the axons. The bundle is believed to contain both efferents and afferents. D and E: Scanning electron microscopy of pre-terminal fibers (yellow) at the habenula perforata. Fiber diameter is between 0.5 and 1.0 μm.
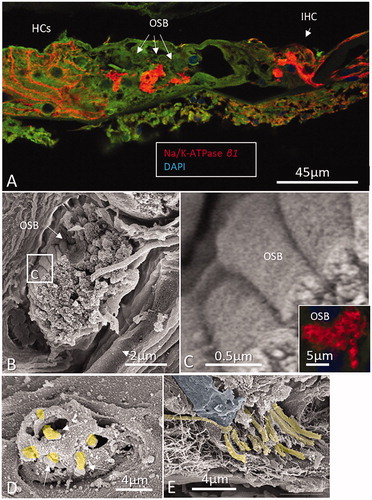
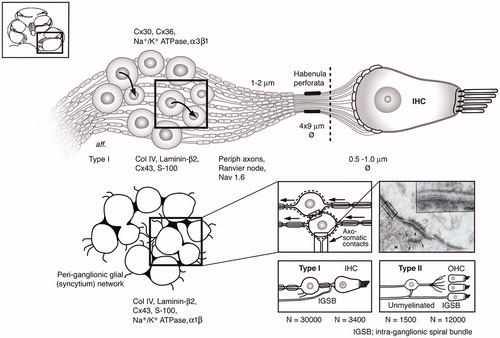
Figure 4. (a) A–C: Na/K-ATPase β1 expression in different turns of the human cochlea. Intensity differences are represented by false color display. There is highest intensity in type II fibrocytes beneath the spiral prominence epithelium. Hensen cells are positive (arrow in A), There is no expression of Na/K-ATPase in the Reissner’s membrane. D–F: Na/K-ATPase β1 expression in the spiral ganglion neurons at different turns showing some variation. Some cells are dislodged basally (arrow in D). Framed area in E is magnified in b) Higher magnification of Na/K-ATPase β1 expression that was revealed in . Framed area is magnified in the inset. Note lack of β1 expression in Reissner’s membrane, intermediate cells (IC), basal cells (BCs), and types I and III fibrocytes. Upper and lower limits of the stria vascularis (marked with asterisks) also lack β1 expression. Inset shows strong Na/K-ATPase activity around the IHC representing neurons and phalangeal and inner sulcus cells. Interdental cells, spiral limbus fibrocytes, and Hensen cells show moderate intensity. There is high activity in the type II fibrocytes of the lateral wall.
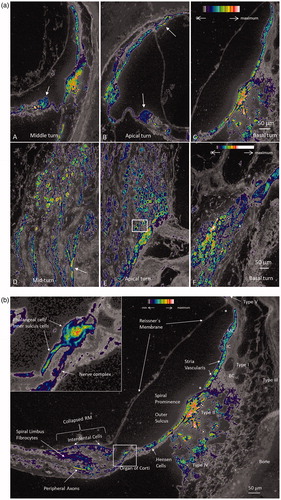
Figure 5. A: SR-SIM showing Na/K-ATPase β1 expression (red) in the type I cell soma plasma membranes. B: Framed area in A shows the expression of Na/K-ATPase β1 at the axon hillock in higher magnification. This isoform is not expressed in the cell membrane of the satellite glial cells (inset). C: CM of the spiral ganglion framed in . Framed area is magnified in D. Some cells lie juxtaposed (*) and show stronger expression of Na/K-ATPase, which is also verified in the false color display in E. F: A type I spiral ganglion cell is surrounded by a satellite glial cell that shows strong expression of Na/K-ATPase α1 (red). The nerve cell body expresses Nav1.6 (green).
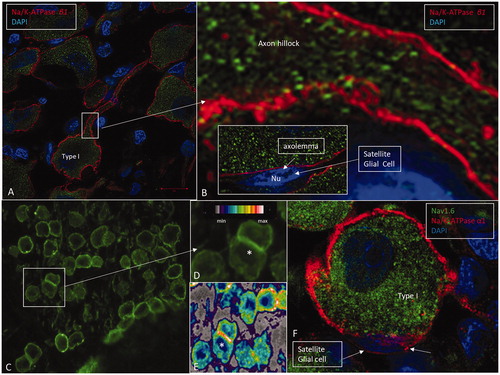
Figure 6. Immunohistochemistry of the human cochlea in a temporal bone obtained at autopsy. A: There is a strong expression of Na/K-ATPase α3 subunit in the spiral ganglion cell bodies, membrane, and nerve fibers. Both type I and type II cells (D) are positive. B: There is a high expression of α3 in the spiral lamina fibers and neurons beneath the IHCs and OHCs. Basal tunnel fibers (BTF-afferents) (inset in B) and efferent tunnel-crossing fibers (TCFs) (C) also express the α3 subunit. E: α1 is intensively expressed in the satellite glial cells at the axon hillock region using CM F: Corresponding type I cell shows α3 expression in the neuron at the axon hillock. OSB: outer spiral bundle; TM: tectorial membrane.
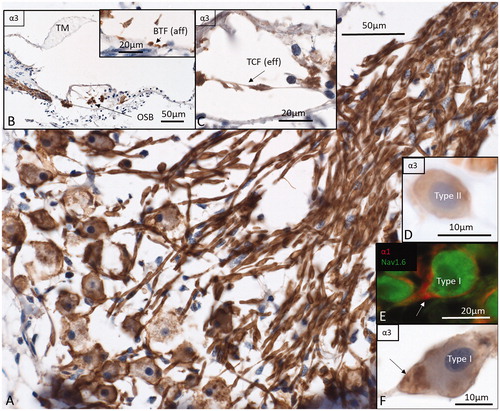
Figure 7. Molecular expression and organization of the principal afferents and ganglion satellite glial syncytium in the human cochlea. Each IHC is innervated by approximately 10–15 primary afferents (large or type I SGNs) with 15–18 synaptic terminals. Small or type II neurons converge from 12,500 OHCs. Unlike in most vertebrates, the human SGN cell bodies are surrounded by thin SGCs forming a more or less continuous network. Axo-somatic synaptic contacts exist on both types I and II cell bodies. Areas with no separating glia layer between type I cell bodies exist in man with both symmetric and asymmetric soma-somatic membrane (Citation41, Citation42). These connections may couple individual cells electrically. Transmission electron microscopy inset shows axo-somatic contact with synapse-like membrane specializations (with permission from Auris Nasus Larynx. Rask-Andersen, et al. 1997;24:1–11). The intra-ganglionic spiral bundle (IGSB) contains efferent fibers from the olivo-cochlear bundle. They leave the inferior vestibular nerve in the internal acoustic canal to reach the cochlear nerve. (Permission to reuse TEM inset in : License Number: 4633560923178; License Date: 21 July 2019; Licensed Content Publisher: Elsevier; Licensed Content Publication: Auris Nasus Larynx; Licensed Content Title: Nerve fibre interaction with large ganglion cells in the human spiral ganglion. A TEM study).