Figures & data
Table 1. Subject characteristics.
Figure 1. Histograms showing the distributions, means, and medians of DNLVLDL-TAG and DNLPlasma-TAG. n = 123.
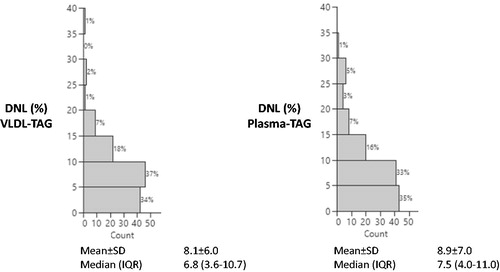
Figure 2. Correlation between DNLVLDL-TAG and DNLPlasma-TAG. n = 123.
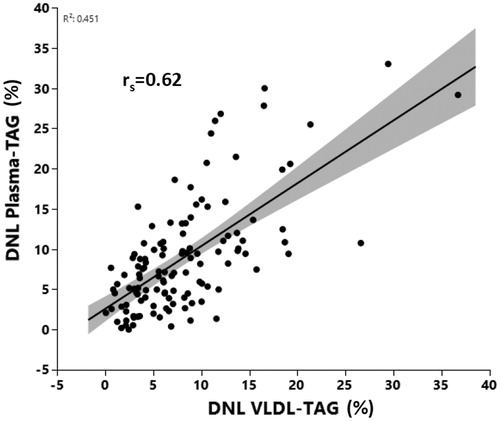
Figure 3. Bland–Altman plot showing the agreement between DNLVLDL-TAG and DNLPlasma-TAG. n = 123.
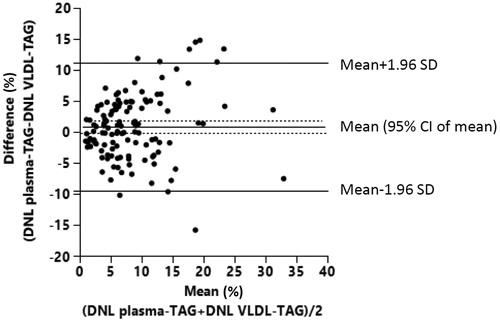
Figure 4. Alluvial plot with subjects split into tertiles based on DNLVLDL-TAG and DNLPlasma-TAG, showing misclassification of subjects when using DNLPlasma-TAG. Median (IQR) DNLVLDL-TAG is shown beside respective tertile. Coloured dots represent composition of the tertile; e.g. red dots (subjects) in the top tertile of DNLPlasma-TAG actually belong to the middle tertile when using DNLVLDL-TAG.
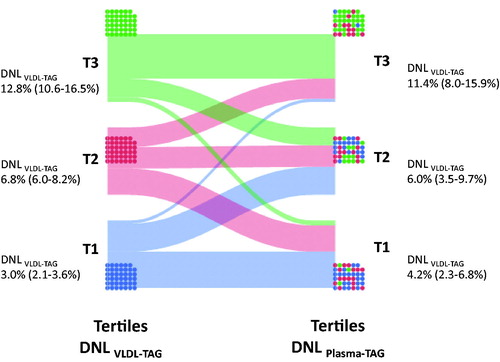
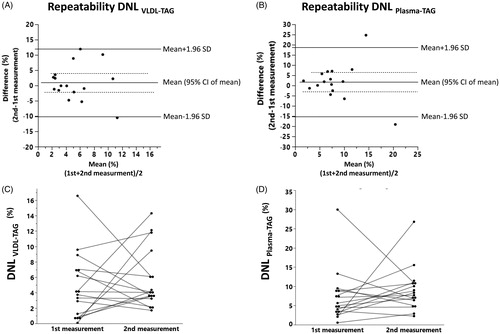
Figure 5. Repeatability of DNL measured in VLDL-TAG and Plasma-TAG. (A) Bland-Altman plot showing mean and difference of the two measurements of DNL in VLDL-TAG; (B) Bland-Altman plot showing mean and difference of the two measurements of DNL in Plasma-TAG; (C) Matched-pair plot showing the individual differences between first and second measurement of DNL in VLDL-TAG; (D) Matched-pair plot showing the individual differences between first and second measurement of DNL in Plasma-TAG. n = 16.