
Figures & data
Figure 1. Flow chart describing the participant recruitment and randomisation process in five hospitals in central Sweden. DA: dietary advice; MNA: Mini Nutritional Assessment; MNA SF: MNA Short Form; ONS: oral nutritional supplements; SPMSQ: Short Portable Mental Status Questionnaire.
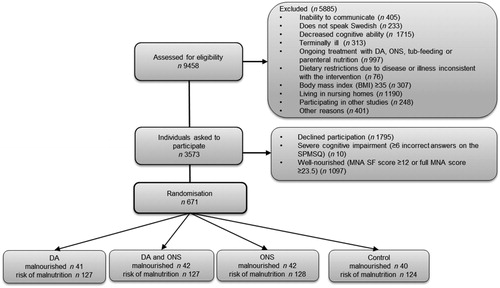
Table 1. Dietary advice given to participants based on the answers from the mini nutritional assessment instrument.
Table 2. Characteristics of the 671 participants at baseline.
Figure 2. Kaplan–Meier survival curves for participants in the four intervention groups (n = 671). Log-rank test for any difference between groups (p = 0.762). DA: dietary advice; ONS: oral nutritional supplements.
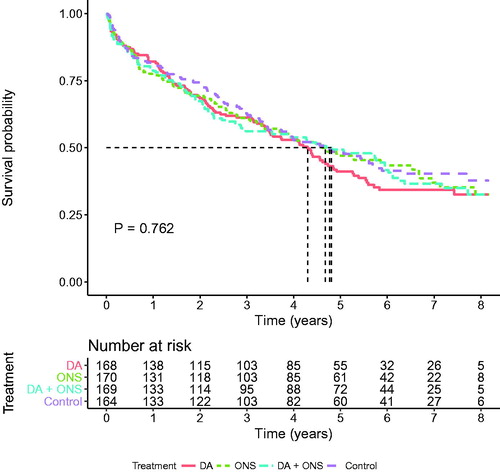
Figure 3. Kaplan–Meier survival curves for participants at risk of malnutrition in the four intervention groups (n = 506). Log-rank test for any difference between groups (p = 0.480). DA: dietary advice; ONS: oral nutritional supplements.
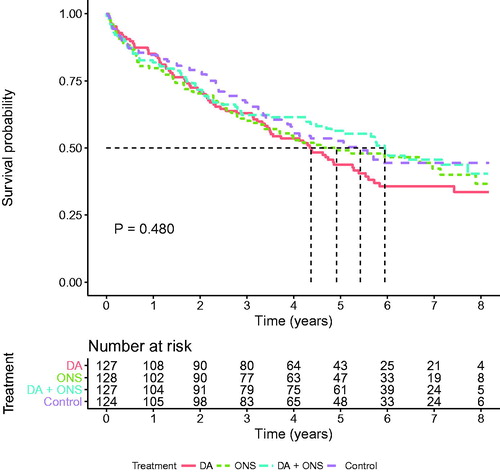
Figure 4. Kaplan–Meier survival curves for malnourished participants in the four intervention groups (n = 165). Log-rank test for any difference between groups (p = 0.298). DA: dietary advice; ONS: oral nutritional supplements.
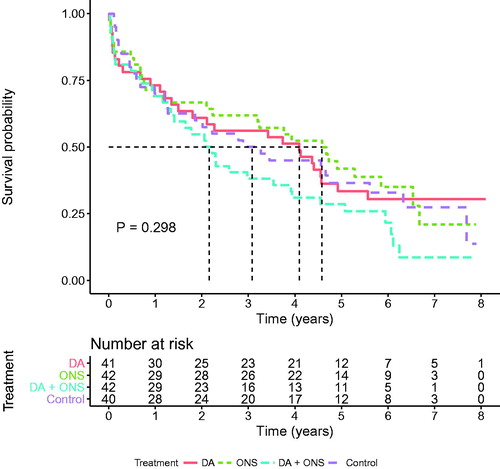
Table 3. All-cause mortality for the three interventions and the control group.