Figures & data
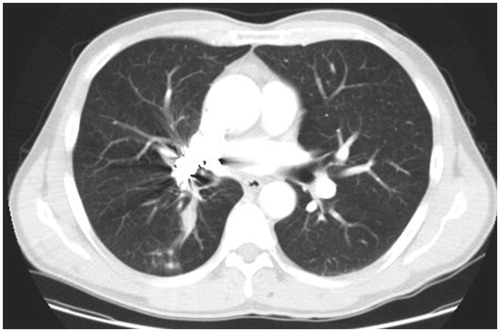
Figure 1. Thoracic CT scan image at the time of diagnosing SqCLC. Contrast-enhanced CT image with soft-tissue window showing a centrally located mass in the right lung with mediastinal invasion (arrow), and mediastinal lymphadenopathy.
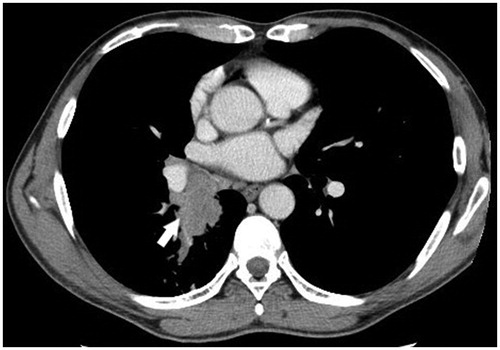
Figure 2. A hypovascular metastatic lesion in the liver. Liver MRI TI W image on post-contrast arterial phase showing a hypo-intense lesion with subtle concentric perilesional enhancement in segment VI of the liver (arrow).
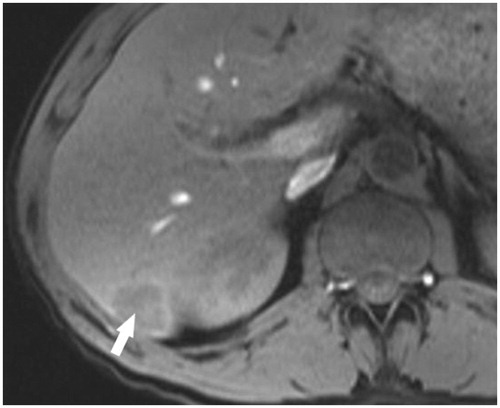
Figure 3. Thoracic CT scan image after the pulmonary artery embolisation procedure. Contrast-enhanced CT image with soft-tissue window showing multiple coils embolised to the right main pulmonary artery, as well as a partially decreased tumour and reduced occlusion of the right lower lobe bronchus.
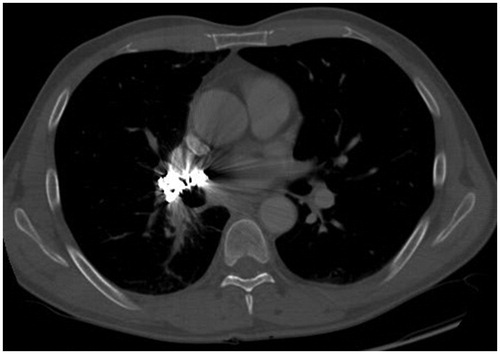
Figure 4. Thoracic CT scan image in 2009. A follow-up contrast-enhanced CT image with soft-tissue window after 2 months of treatment with second-line chemotherapy showing an increased tumour in the right lung.