Figures & data
Figure 1. Perfusion, glomerular filtration rate (GFR), and diuresis in kidneys perfused with 6% or 7.5% bovine serum albumin (BSA), respectively. *p < 0.05 between groups, repeated measures ANOVA.
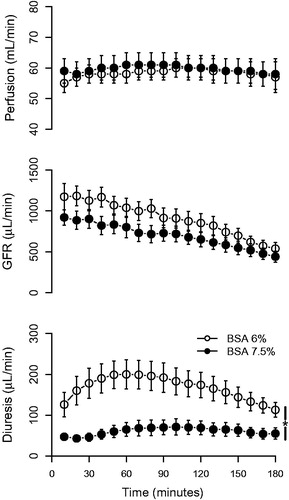
Table 1. Three-hour mean values in kidneys perfused with 6% or 7.5% bovine serum albumin (BSA) or 7.5% BSA + desmopressin (DDAVP; 400 ng/L).
Figure 2. Urine osmolality, fractional calcium (FRCa), and sodium reabsorption (FRNa) in kidneys perfused with desmopressin (DDAVP; 400 ng/L) compared to control experiments. The bars represent mean values from the period 90–180 min (indicated by the line). Albumin concentration in the perfusate was 7.5%. *p < 0.05 versus control.
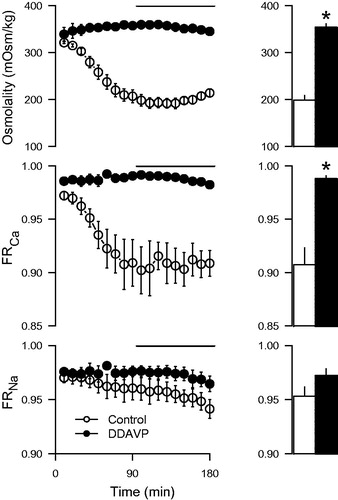
Figure 3. Correlation between change (Δ) in urine osmolality (A) and urine flow (B) and fractional calcium reabsorption (FRCa) in kidneys perfused with 7.5% albumin without DDAVP. Values are calculated as the change from the first 10-min period up to 60 min into the experiment. The values are individual time points derived from the two experimental groups without added DDAVP. A straight line was fitted to the data using linear regression, with the square of the correlation coefficient (R2) indicated.
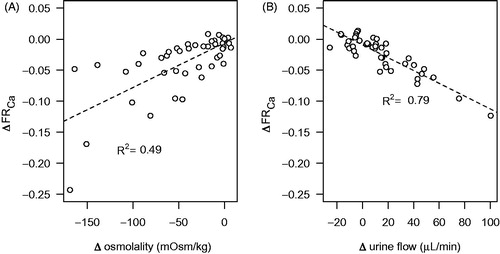
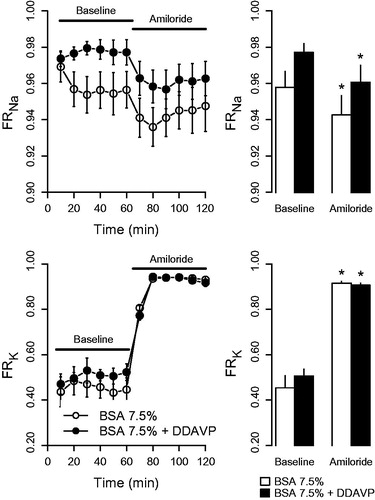
Figure 4. Fractional reabsorption of sodium (FRNa) and potassium (FRK) in response to amiloride (5 µmol/L) in kidneys perfused with BSA 7.5% or BSA 7.5% + desmopressin (DDAVP; 400 ng/L). The left panel presents the time series data of fractions observed during the 120-min experiment period, whereas the right panel displays mean values at baseline (0–60 min) and at amiloride exposure (60–120 min). *p < 0.05 versus baseline.