1,669
Views
6
CrossRef citations to date
0
Altmetric
Original Articles

Proteomics to predict the response to tumour necrosis factor-α inhibitors in rheumatoid arthritis using a supervised cluster-analysis based protein score

, , , , , , , , , & show all
Pages 12-21 | Accepted 16 Mar 2017, Published online: 26 Jun 2017

Figures & data

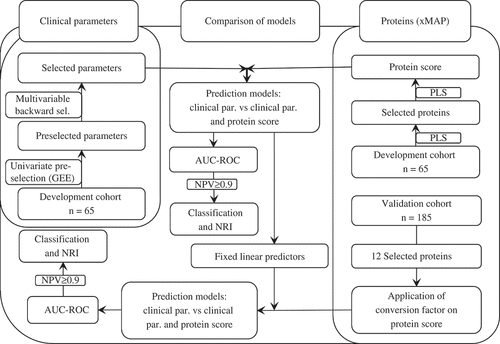
Figure 1. Overview of statistical analyses. The pathways denoted by black–dotted and grey–straight lines represent the analyses performed in the development and validation steps, respectively. AUC-ROC, area under the receiving operating characteristic curve; GEE, generalized estimation equations; NPV, negative predictive value; NRI, net reclassification index; PLS, partial least squares; par., parameters; sel., selection.

Figure 1. Overview of statistical analyses. The pathways denoted by black–dotted and grey–straight lines represent the analyses performed in the development and validation steps, respectively. AUC-ROC, area under the receiving operating characteristic curve; GEE, generalized estimation equations; NPV, negative predictive value; NRI, net reclassification index; PLS, partial least squares; par., parameters; sel., selection.

Table 1. Baseline characteristics of development (n = 65) and validation cohort (n = 185) before multiple imputation.

Table 2. Models for (baseline) prediction of response in development cohort (n = 65).

Table 3. Risk categories for probability on European League Against Rheumatism (EULAR) good response in the development cohort (n = 65).

Table 4. Risk categories for European League Against Rheumatism (EULAR) good response in the validation cohort (n = 185).

Table 5. Non-exhaustive overview of studies with a proteomic approach to identify baseline predictive proteins regarding response to tumour necrosis factor-α inhibitor (TNFi) treatment.
Supplemental material

cuppen_supplementary_material.pdf

Download PDF (239.3 KB)