1,751
Views
7
CrossRef citations to date
0
Altmetric
Original Articles

Prognostic factors for change in self-reported anxiety and depression in spondyloarthritis patients: data from the population-based SpAScania cohort from southern Sweden

, , , , &
Pages 185-193 | Accepted 30 Jun 2017, Published online: 16 Aug 2017

Figures & data

Table 1. Sociodemographics and patient-reported outcome measures (PROMs) for the spondyloarthritis patients in the 2009 and 2011 cohorts (n = 1629).

Figure 1. Self-reported anxiety: transitions between the three Hospital Anxiety and Depression Scale subscale Anxiety (HADS-A) classes (class I: 0–8 ‘no case’; class II: 8–11 ‘possible case’; and class III: 11–21 ‘probable case’ of anxiety) over a 2 year follow-up period of all patients in the SpAScania cohort who responded to both the 2009 and 2011 questionnaires and had a valid HADS-A score at both time-points (n = 1586).

Figure 1. Self-reported anxiety: transitions between the three Hospital Anxiety and Depression Scale subscale Anxiety (HADS-A) classes (class I: 0–8 ‘no case’; class II: 8–11 ‘possible case’; and class III: 11–21 ‘probable case’ of anxiety) over a 2 year follow-up period of all patients in the SpAScania cohort who responded to both the 2009 and 2011 questionnaires and had a valid HADS-A score at both time-points (n = 1586).

Figure 2. Self-reported depression: transitions between the three Hospital Anxiety and Depression Scale subscale Depression (HADS-D) classes (class I: 0–8 ‘no case’; class II: 8–11 ‘possible case’; and class III: 11–21 ‘probable case’ of depression) over a 2 year follow-up period of all patients in the SpAScania cohort who responded to both the 2009 and 2011 questionnaires and had a valid HADS-D score at both time-points (n = 1589).

Figure 2. Self-reported depression: transitions between the three Hospital Anxiety and Depression Scale subscale Depression (HADS-D) classes (class I: 0–8 ‘no case’; class II: 8–11 ‘possible case’; and class III: 11–21 ‘probable case’ of depression) over a 2 year follow-up period of all patients in the SpAScania cohort who responded to both the 2009 and 2011 questionnaires and had a valid HADS-D score at both time-points (n = 1589).

Table 2. Logistic regression analysis of stable disease vs improving to non-disease based on the Hospital Anxiety and Depression Scale (HADS) as the dependent variable and all independent variables entered separately in the model.
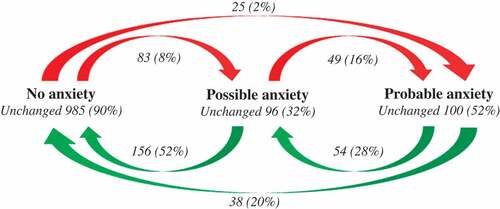
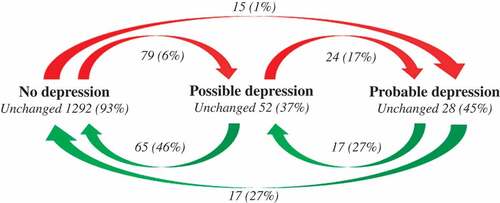
Table 3. Logistic regression analysis of stable non-disease vs deteriorating to possible or probable disease based on the Hospital Anxiety and Depression Scale (HADS) as the dependent variable and all independent variables entered separately in the model.