Figures & data
Table 1. Patient characteristics
Figure 1. Differences in arterial stiffness, assessed by mean aortic pulse wave velocity (aPWV) and median augmentation index (AIx@75), across the inflammatory joint disease (IJD) entities: rheumatoid arthritis (RA), ankylosing spondylitis (AS), and psoriatic arthritis (PsA). • Unadjusted data; ○ adjusted data. Error bars represent the standard error. *Significant difference (p < 0.05) from RA. aPWV adjusted for age and heart rate; AIx@75 adjusted only for age.

Table 2. Comparison of traditional cardiovascular disease (CVD) risk factors, haemodynamic factors, and medication use between patients with high and low aortic pulse wave velocity (aPWV)
Table 3. Associations between arterial stiffness and cardiovascular disease (CVD) risk factors, haemodynamic factors, and medication use
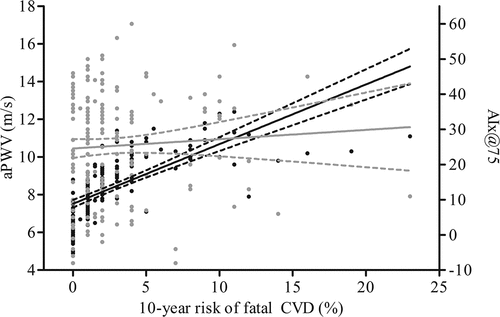
Figure 2. Relationship between cardiovascular disease (CVD) risk estimation by the Systematic COronary Risk Evaluation (SCORE) algorithm and arterial stiffness, expressed as aortic pulse wave velocity (aPWV) and augmentation index (AIx@75). y(PWV) = 7.52 + 0.32x; r2 (PWV) = 0.49. y(AIx@75) = 24.57 + 0.26x; r2 (AIx@75) = 0.0038. Solid black line: regression line of aPWV; dashed black line: confidence interval of regression line of aPWV; solid grey line: regression line of AIx@75; dashed grey line: confidence interval of regression line of AIx@75.

