Figures & data
Figure 1. Participant enrolment.
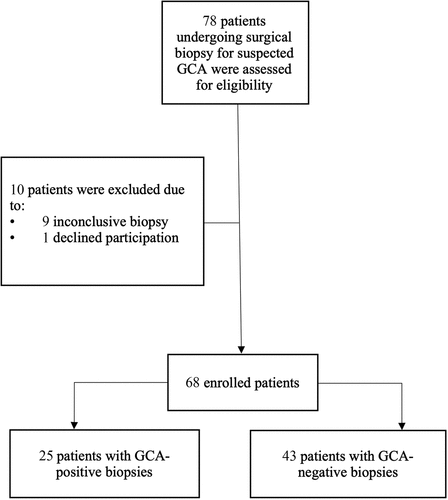
Table 1. Patient characteristics.
Figure 2. Illustration of the ultrasound scanning set-up used to examine the temporal artery biopsy (TAB). (A) The sample is mounted in a Perspex container filled with balanced saline solution. The artery is then scanned with an ultrasound transducer that is attached to an adjustable arm using a linear stepper motor that moves transversely with a step size of 0.5 mm. (B) The scanning procedure results in a stack of 2D ultrasound images containing B-mode images (short pulse) interleaved with images generated using colour Doppler mode (long pulse). (C) A 3D image is then reconstructed from the slices of the 2D images, and the mean centre frequency shift (CFS) is calculated from the pixels from the whole specimen.
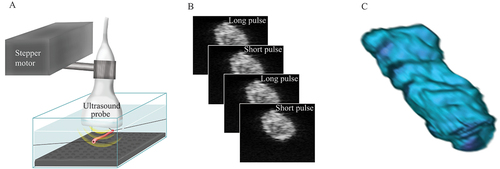
Figure 3. Illustration of the principle of centre frequency shift (CFS) due to differences in the size of the scatterers in the tissue and pulse wavelength. An ultrasound pulse is transmitted into the tissue, where it is reflected, and the signal is recorded by the transducer. The frequency distribution of the backscattered ultrasound will depend on the size of the scatterers, in relation to the wavelengths, i.e. frequency content, of the pulse. Small scatterers (A and C) will return a greater proportion of high frequencies than large scatterers (B and D). Furthermore, short pulses (A and B) contain more frequencies, leading to a greater CFS than with longer pulses (C and D). The shift in the backscattered centre frequency depends on the size of the microstructures in the tissue, providing an objective measure of the differences between healthy and diseased tissues.
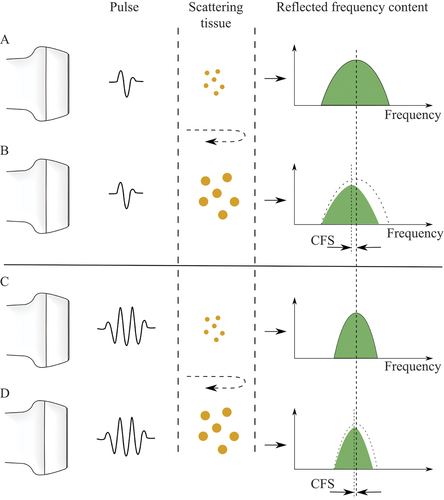
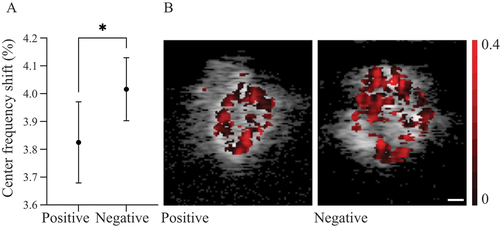
Figure 4. (A) Graph showing the centre frequency shifts (CFS) for temporal artery biopsy TAB-positive and TAB-negative biopsies. Data are presented as mean values with 95% confidence intervals. *Significant difference between the two groups (p < 0.05). (B) Representative examples of CFS images of a TAB-positive (left) and a TAB-negative (right) specimen of the temporal artery. The value of CFS (%) for each pixel is shown as a darker (red) overlay. The scale bar is 0.1 mm.