
Figures & data
Table 1. Patient characteristics and comparison of the sub-cohorts.
Figure 1. Treatment lines before initiation and after discontinuation of apremilast among patients with psoriatic arthritis (PsA) and patients with psoriasis (PsO). (Other medication: azathioprine, hydroxychloroquine, or sodium aurothiomalate). TNF, tumour necrosis factor.
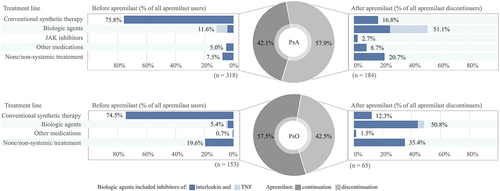
Figure 2. Kaplan–Meier analysis of apremilast persistence. (A) Patients with psoriatic arthritis (PsA) and patients with psoriasis (PsO); (B) treatment line before apremilast initiation (the most recent treatment before apremilast initiation); (C) age group. y-axis: probability of continuing apremilast treatment; x-axis: time from apremilast initiation to discontinuation (months).
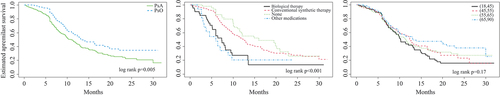
Table 2. Multivariate Cox regression analysis of apremilast discontinuation.