Figures & data
Table 1. Baseline characteristics.
Figure 1. (A) Total immunoglobulin G (IgG)/immunoglobulin M (IgM) ratios, (B) IgG/IgM anti-double-stranded DNA (anti-dsDNA), (C) anti-Ro52, and (D) anti-Ro60 ratios for healthy controls (HCs), incomplete systemic lupus erythematosus (iSLE), and systemic lupus erythematosus (SLE) patients. Boxplots show median and interquartile range. **p ≤ 0.01; ***p ≤ 0.00; ns, not significant.
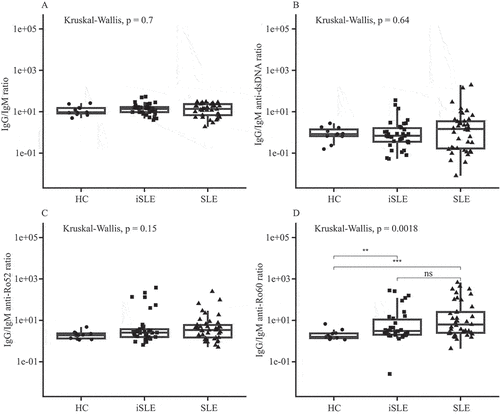
Figure 2. (A) Total immunoglobulin M (IgM), (B) IgM anti-double-stranded DNA (anti-dsDNA), (C) IgM anti-Ro52, and (D) IgM anti-Ro60 levels. Boxplots show median and interquartile range. HC, healthy control; iSLE, incomplete systemic lupus erythematosus; SLE, systemic lupus erythematosus; RU, FEIA response units. *p ≤ 0.05; ***p ≤ 0.001; ns, not significant.
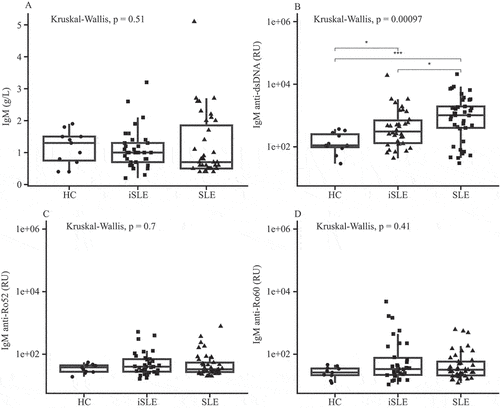
Figure 3. Immunoglobulin M (IgM) autoantibody levels for (A) immunoglobulin G (IgG) anti-double-stranded DNA (anti-dsDNA), (B) anti-Ro52, and (C) anti-Ro60 positive (pos) and negative (neg) incomplete systemic lupus erythematosus (iSLE) and systemic lupus erythematosus (SLE) patients. Boxplots show median and interquartile ranges. RU, FEIA response units.
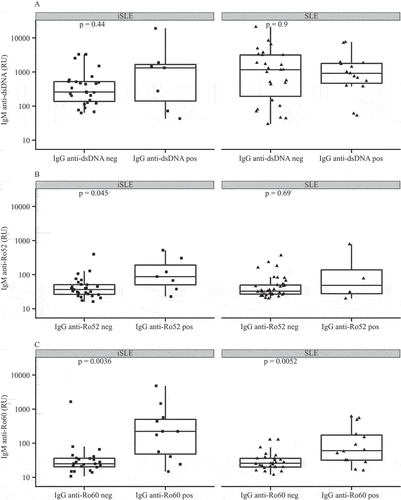
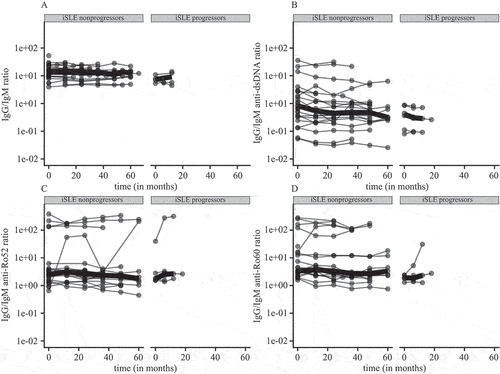
Figure 4. (A–D) Immunoglobulin G (IgG)/immunoglobulin M (IgM) ratios for incomplete systemic lupus erythematosus (iSLE) non-progressors and systemic lupus erythematosus (SLE) progressors over time. IgG/IgM ratios per patient are depicted as dots and connected by lines. Thick lines show median ratios per group over time.