Figures & data
Table 1 Numbers of snail shells used for analysis from each location together with subjective habitat scores for vegetation and apparent moisture at each site.
Figure 1 Map showing locations where Placostylus snails were collected.
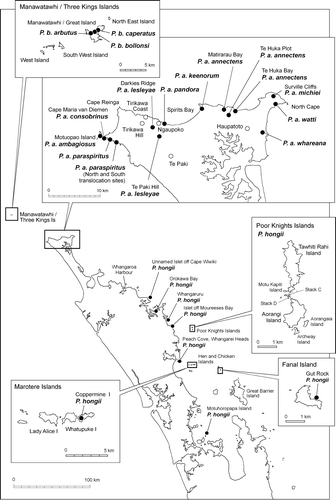
Figure 2 Measurements taken from the shells of Placostylus snails.
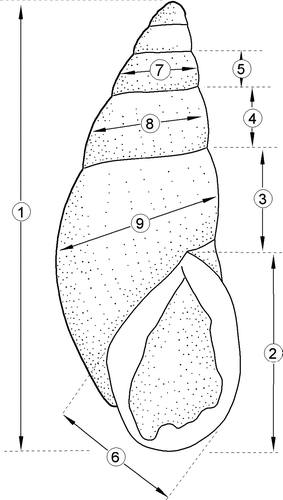
Figure 3 Relationship between shell length and location for New Zealand species of Placostylus land snails. Taxa are ordered firstly by species and then by geographic proximity. Habitat types are given in .
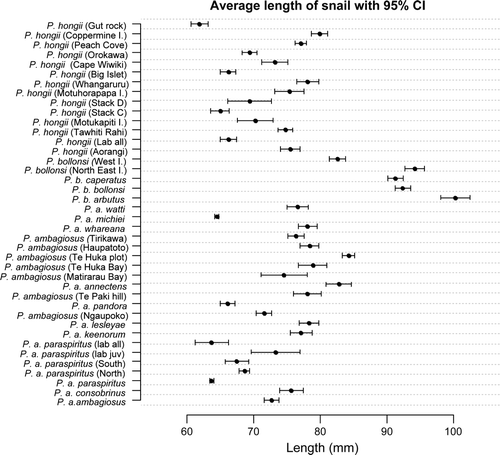
Figure 4 Mean shell height in relation to species, habitat factors of dampness level and vegetation type using a classification tree analysis. Mean shell heights in mm.
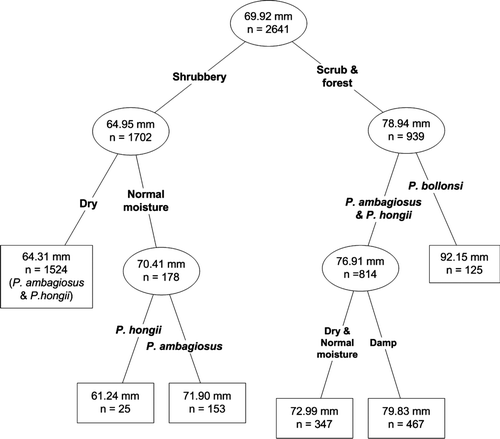
Table 2 Mean shell height (mm) in relation to species, habitat factors of moisture level and vegetation type. Vegetation types and moisture levels are provided in
Table 3 Relationship between shell height and the habitat variables of moisture level and vegetation type as shown by modelling using a mixed effects model
Figure 5 Relationship between the shapes of P. ambagiosus, P. bollonsi and P. hongii shells from the field as shown; A, Non-metric multidimensional scaling and; B, Principal component analysis. Data were 9 different measurements from each shell. Percentage figures on axes give proportion of variation accounted for by the analysis.
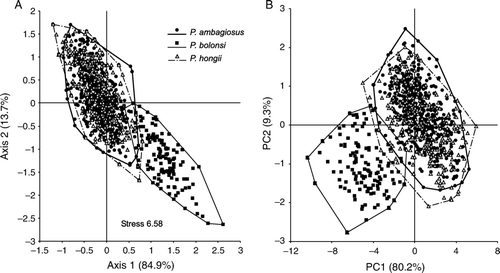
Figure 6 Variation in shape of P. ambagiosus, P. bollonsi and P. hongii shells in relation to the vegetation where they live as shown with non-metric multidimensional scaling using 9 measurements taken from each shell. Outer limits of the distributions (convex polygons as shown in ) are shown and centroids are included in A.
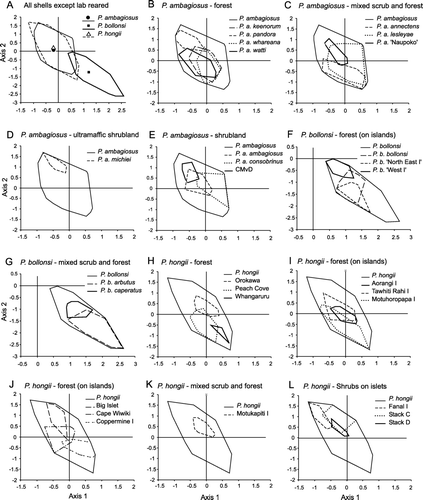
Figure 7 Variation in shell-shape of P. ambagiosus, P. bollonsi and P. hongii shells in relation to the vegetation where they live as shown principal component analysis using 9 measurements taken from each shell. Outer limits of the distributions (convex polygons as shown in ) are shown and centroids are included in A.
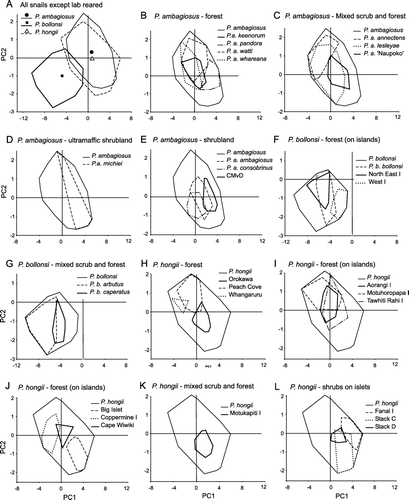
Table 4 Comparisons between the shell-shapes of snails from different habitat types
Table 5 Comparisons between the shell-shapes of P. ambagiosus and P. hongii from the same habitats
Figure 8 Effect on the shell-shape of Placostylus ambagiosus and P. hongi of laboratory rearing and transfer to a different habitat type as shown with non-metric multidimensional scaling. Convex bounding polygons and centroids are shown for both reared and translocated snails and their parent populations. Outer convex polygons show variation for the species as given in .
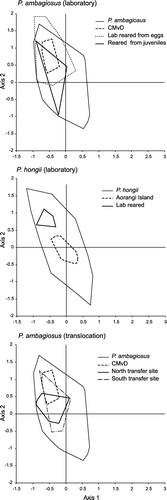
Table 6 Comparisons between the shell-shapes of laboratory reared snails and snails from populations that had originated by translocation with snails from the source populations
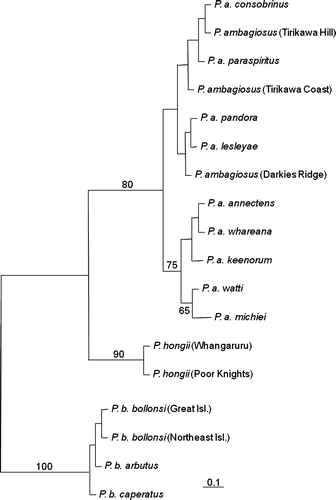
Figure 9 Maximum likelihood tree estimated under the HKY+I model for the COI sequences. Branch lengths are drawn proportional to the expected number of substitutions per site (see scale bar). Numbers above and adjacent to nodes are bootstrap proportions. Each individual is labelled with taxon, followed by population only in the case where the population is of uncertain identification, then by sample code and by haplotypes in bold.
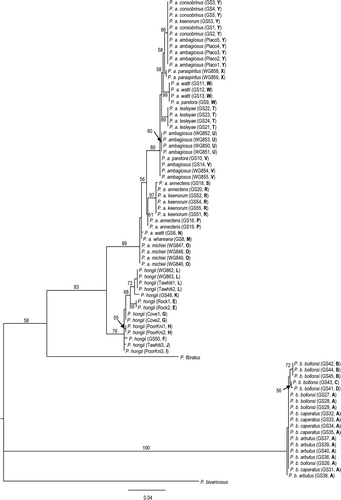
Figure 10 Maximum parsimony networks for the COI data. Large circle represent sampled haplotypes (A–Y). Short bars represent the number of mutational steps between haplotypes. Dotted arrows show the position of the root as inferred by the maximum likelihood phylogenetic analysis in .
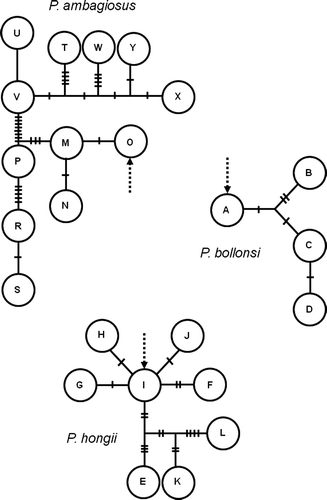
Figure 11 Bayesian tree estimated under the Mkv model for the allozyme data. Branch lengths are drawn proportional to the expected number of changes per character and numbers above nodes are estimated posterior probabilities.