Figures & data
Figure 1. Otago skink enclosure, showing the fence, schist rock piles, and some vegetation. Photograph taken on 12 October 2014 by Alison Cree.
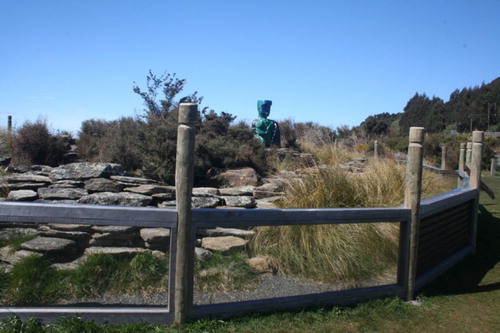
Figure 2. Number of skinks detected over an hour of visual observations. A, At different times of the day during the hours that Orokonui Ecosanctuary was open; B, in relation to precipitation (Dry = no precipitation, 1 = light precipitation from low cloud, 2 = rain); C, in relation to temperature measured using a copper model of a skink placed in full sunlight (n = 20 observations; fitted line from the generalised additive model is shown); D, in response to the temperature measured in shade under a rock 20 cm into a retreat (n = 20 observations).