
Figures & data
Figure 1. The 138 nucleotide region of the mitochondrial d-loop amplified by the primers Clade_1For, Clade_2For and Clade 1/2Rev. The consensus sequence uses the IUPAC codes for variable sites in the alignment (r = A or G, y = C or T).
Table 1. Primer sequences used in polymerase chain reactions to identify the clades to which each Adélie penguin belongs.
Figure 2. Melt curve profiles for the Antarctic (A) and the Ross Sea (RS) Adélie penguin assays run on sample 121 (a Ross Sea haplotype bird). The peak at 77 °C for the Ross Sea assay is a positive result. dF/dT is the change in fluorescence over the change in time.
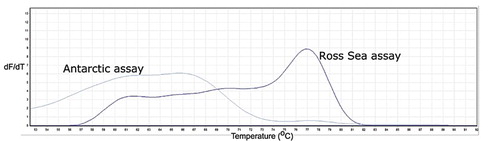
Table 2. Clade identification using high-resolution melt curves compared with clade identification from sequencing (i.e. sequencing 651 nucleotide region of the mitochondrial d-loop) in Adélie penguins.
Supplemental material